FIGURE 1.

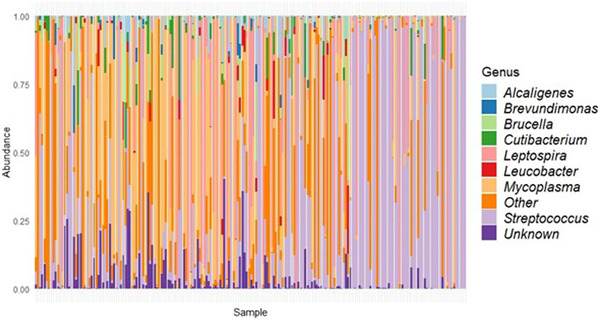
Bar plot displaying the relative abundance of bacteria (y‐axis) per sample (x‐axis) at genus level. Samples are in order of 16S rRNA amplicon concentration from low (left) to high (right).

Bar plot displaying the relative abundance of bacteria (y‐axis) per sample (x‐axis) at genus level. Samples are in order of 16S rRNA amplicon concentration from low (left) to high (right).