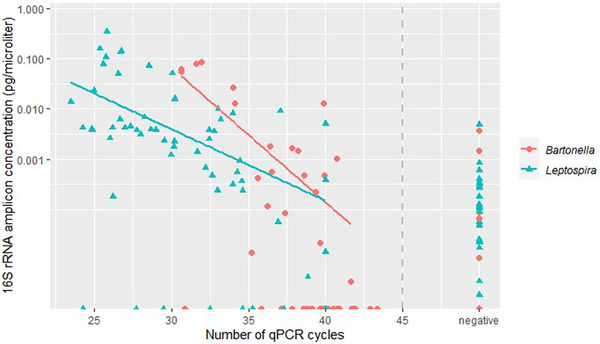
FIGURE 2.

Comparison between the number of qPCR cycles and the 16S rRNA amplicon concentration for both Leptospira and Bartonella. The qPCRs are pathogen‐specific and shows at which cycle number the samples were found positive. The 16S rRNA amplicon concentration was calculated by multiplying the percentage of Leptospira or Bartonella reads per sample with the 16S rRNA gene amplicon concentration per sample. The y‐axis is log‐scaled. Samples with Ct values >45 and/or non‐sigmoidal curves are included in ‘negative’. The qPCR cut‐off value of 45 is represented by a grey dashed line. There is a negative correlation between the 16S rRNA amplicon concentration and the number of qPCR cycles for both Leptospira and Bartonella.
