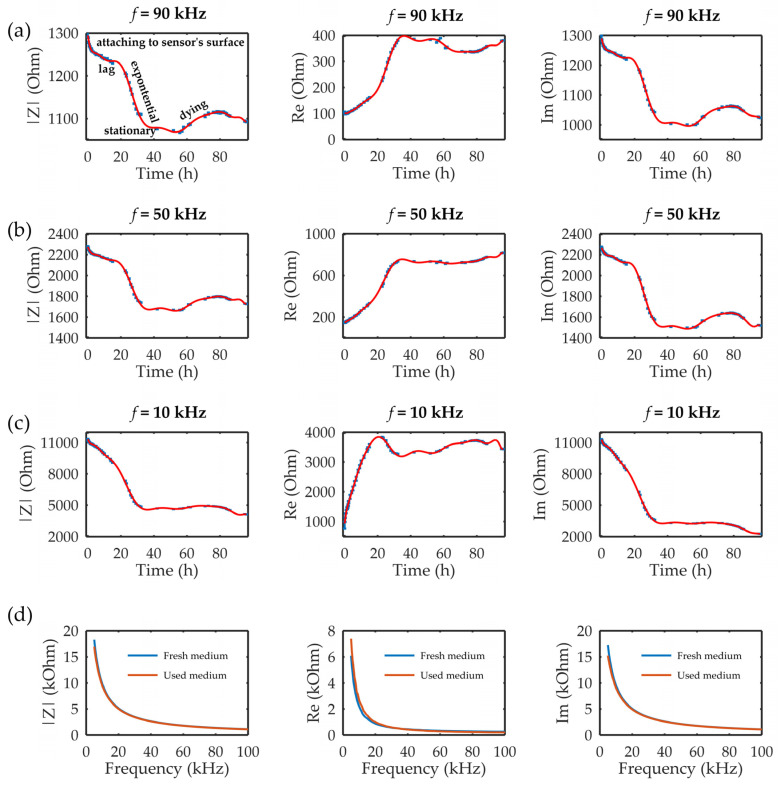
Figure 4.
The impedance module (|Z|) and the real (Re) and imaginary (Im) parts of the impedance at three different frequencies in the measured frequency range: (a) 90, (b) 50, and (c) 10 kHz during 96 h of MRC-5 cultivation in the microbioreactor. The error bars in the graph represent standard deviations. (d) Control measurements for comparisons of fresh and used medium, i.e., medium after 96 h of cultivation, in terms of |Z| and the Re and Im parts.

