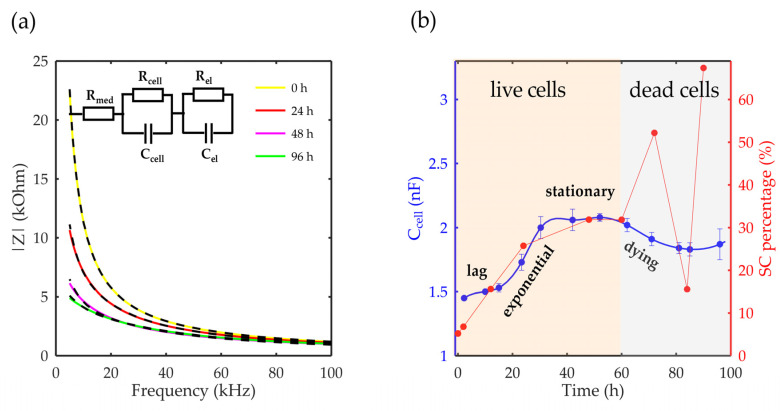
Figure 5.
Fitting results: (a) The impedance module in the function of frequency for 0, 24, 48, and 96 h of cultivation. The black curves represent the fitted results, with the equivalent circuit presented in the inset. (b) Cell capacitance in the function of the cultivation time compared with the image processing results. The error bars in the graph represent the standard deviations of the equivalent circuit model and the image processing from images at three different places in the microbioreactor.

