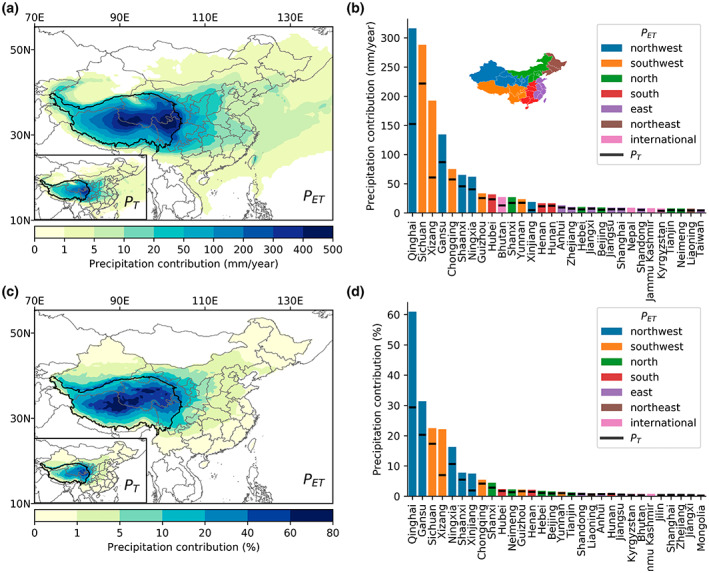
FIGURE 4.

Contribution of Tibetan Plateau ecosystems to annual precipitation through evapotranspiration (P ET) and transpiration (P T). The spatial pattern and regional statistics of absolute (a, b) and relative precipitation contribution (c, d). Note that areas with absolute precipitation contribution <1 mm/year were masked on (a). The relative contribution was calculated as precipitation contribution divided by local precipitation of ERA5. Only the top 30 regions are shown in the bar chart. Provincial‐level administrative units in China are grouped into six sub‐regions indicated on the map of (b). Map lines delineate study areas and do not necessarily depict accepted national boundaries.
