
Figure 7.
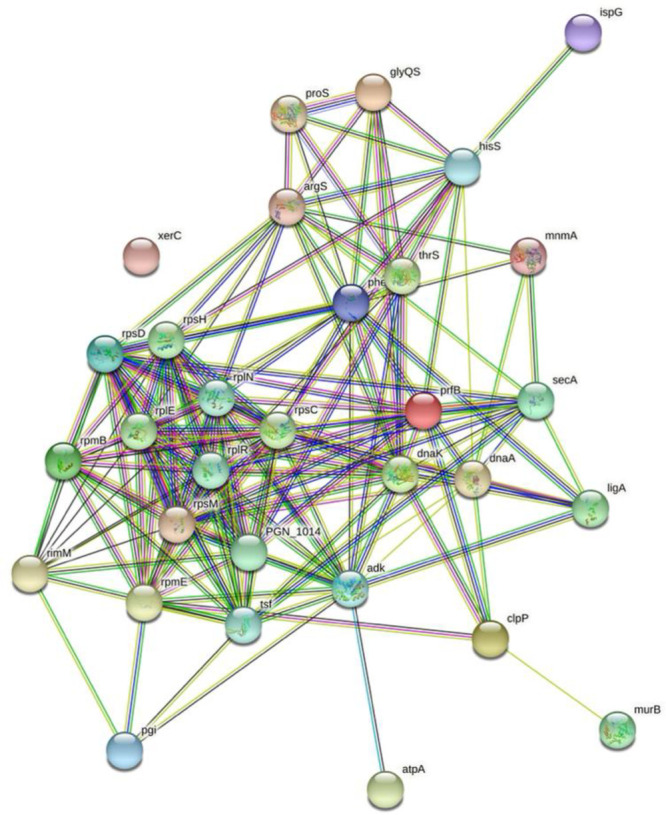
Protein–protein interaction network of the differentially expressed proteins between the control, JR-treated, and MA-treated samples using STRING v11.0 (https://string-db.org/). Nodes and edges are displayed, and an increasing number of edges indicate greater interactions.