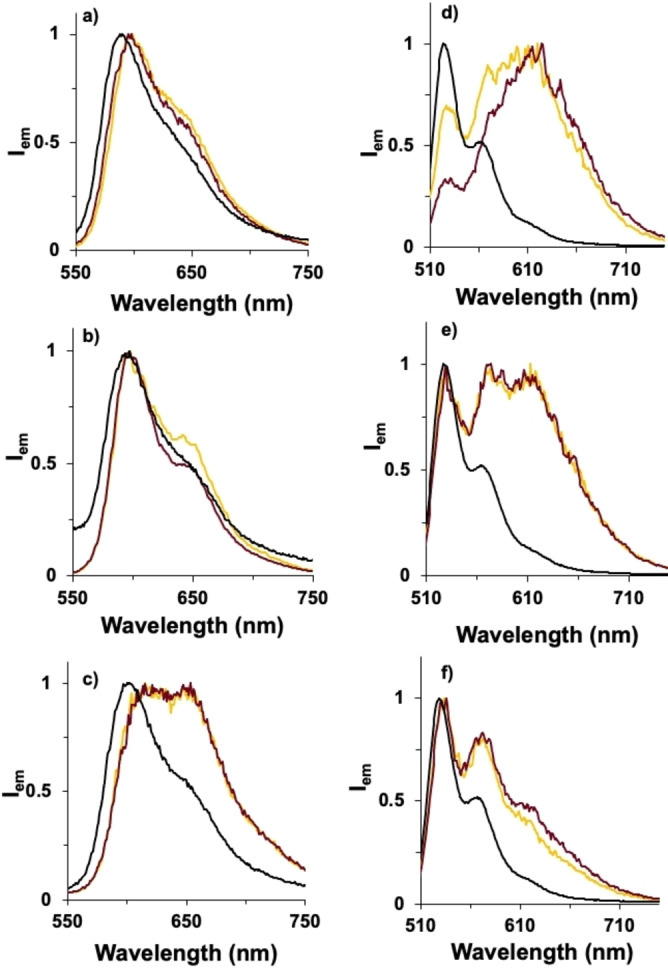
Figure 2.

Normalized fluorescence emission of a) o ‐DPP‐, b) m ‐DPP‐, c) p ‐DPP‐grafted helical ribbons (λex=530 nm, methanol) and d) o ‐PMIDE‐, e) m ‐PMIDE, f) p ‐PMIDE‐grafted helical ribbons (λex=510 nm, chloroform). Black lines correspond to free dyes, yellow and red lines to the dyes grafted on the surface of right‐ and left‐handed helical ribbons, respectively. See Figures S4–S5 for the emission spectra from twisted ribbons.
