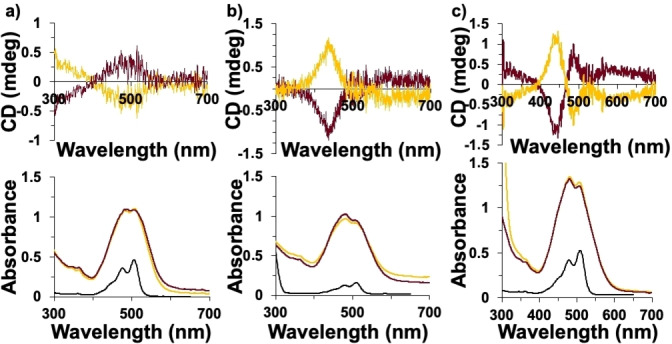
Figure 4.

CD (top) and UV‐vis spectra (bottom) in chloroform of a) o ‐PMIDE, b) m ‐PMIDE, and c) p ‐PMIDE before and after grafting on the surface of helical ribbons. Black lines correspond to dyes‐free, yellow and red lines correspond to the dyes grafted on the surface of right‐ and left‐handed helical ribbons, respectively.
