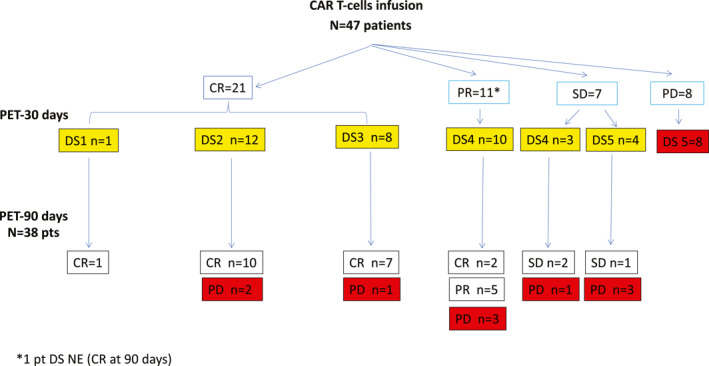
FIGURE 2.

CONSORT diagram showing response of patients at 30 days after chimeric antigen receptor T‐cells according to Lugano criteria and detailed by DS assessment. In the bottom section of the diagram: disease response at 90 days according to Lugano criteria. Patients highlighted in yellow are the patients considered for study analysis. DS indicates Deauville score; CR, complete response; PR, partial response; SD, stable disease; PD, progressive disease; NE, not evaluable
