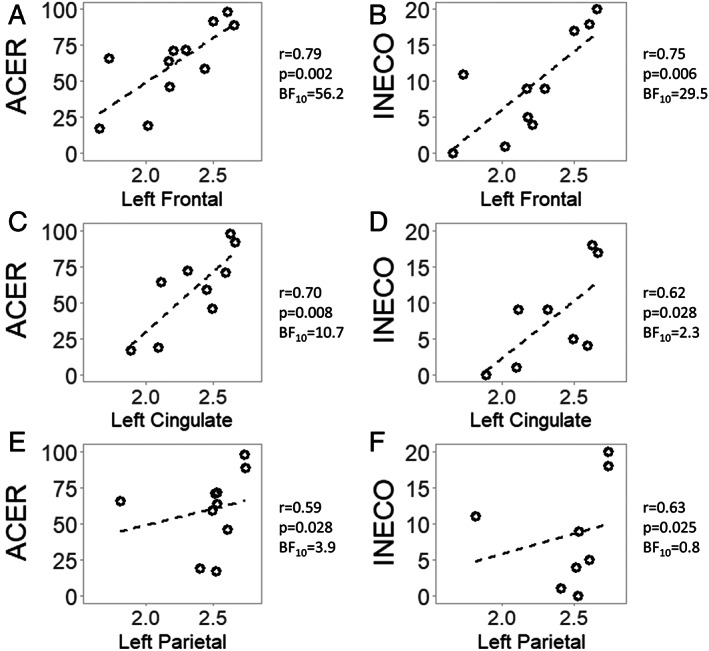
FIGURE 4.

Correlations between regional synaptic density and cognitive performance. [11C]UCB‐J nondisplaceable binding potential (BPND) in a cortical region is reported on the x axis, while the y axis represents a cognitive test score. ACER = revised Addenbrooke Cognitive Examination; BF = Bayes factor; r = Spearman rho.
