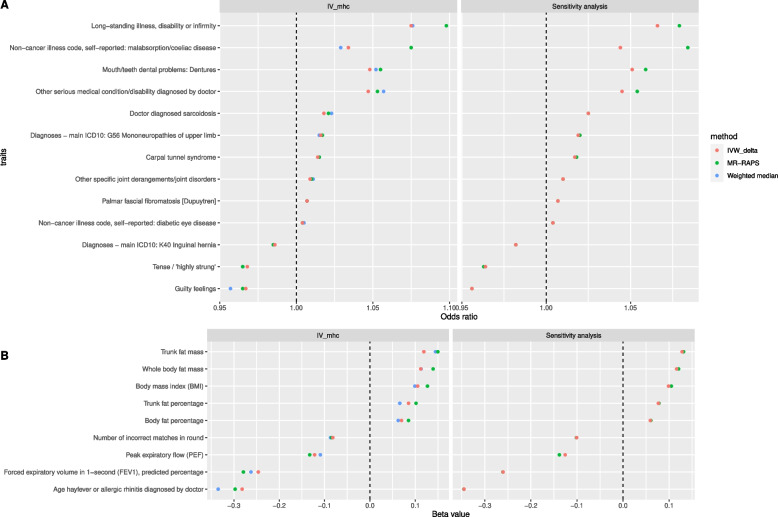
Fig. 2.
Traits causally affected by anti-VZV IgG levels. Listed are traits with statistical evidence (FDR < 0.05) in at least three Mendelian randomization (MR) methods, using instrumental variables inside the MHC region (IVmhc) (left panel). The results are consistent in the sensitivity analyses (right panel). Odds ratio (A, horizontal axis), for a binary case/control trait, represents the estimated odds ratio when the anti-VZV IgG levels increase by 9 times. Beta value (B, horizontal axis), for a continuous trait, represents the estimated change in the tested trait when the anti-VZV IgG levels increase by 9 times

