
Figure 1.
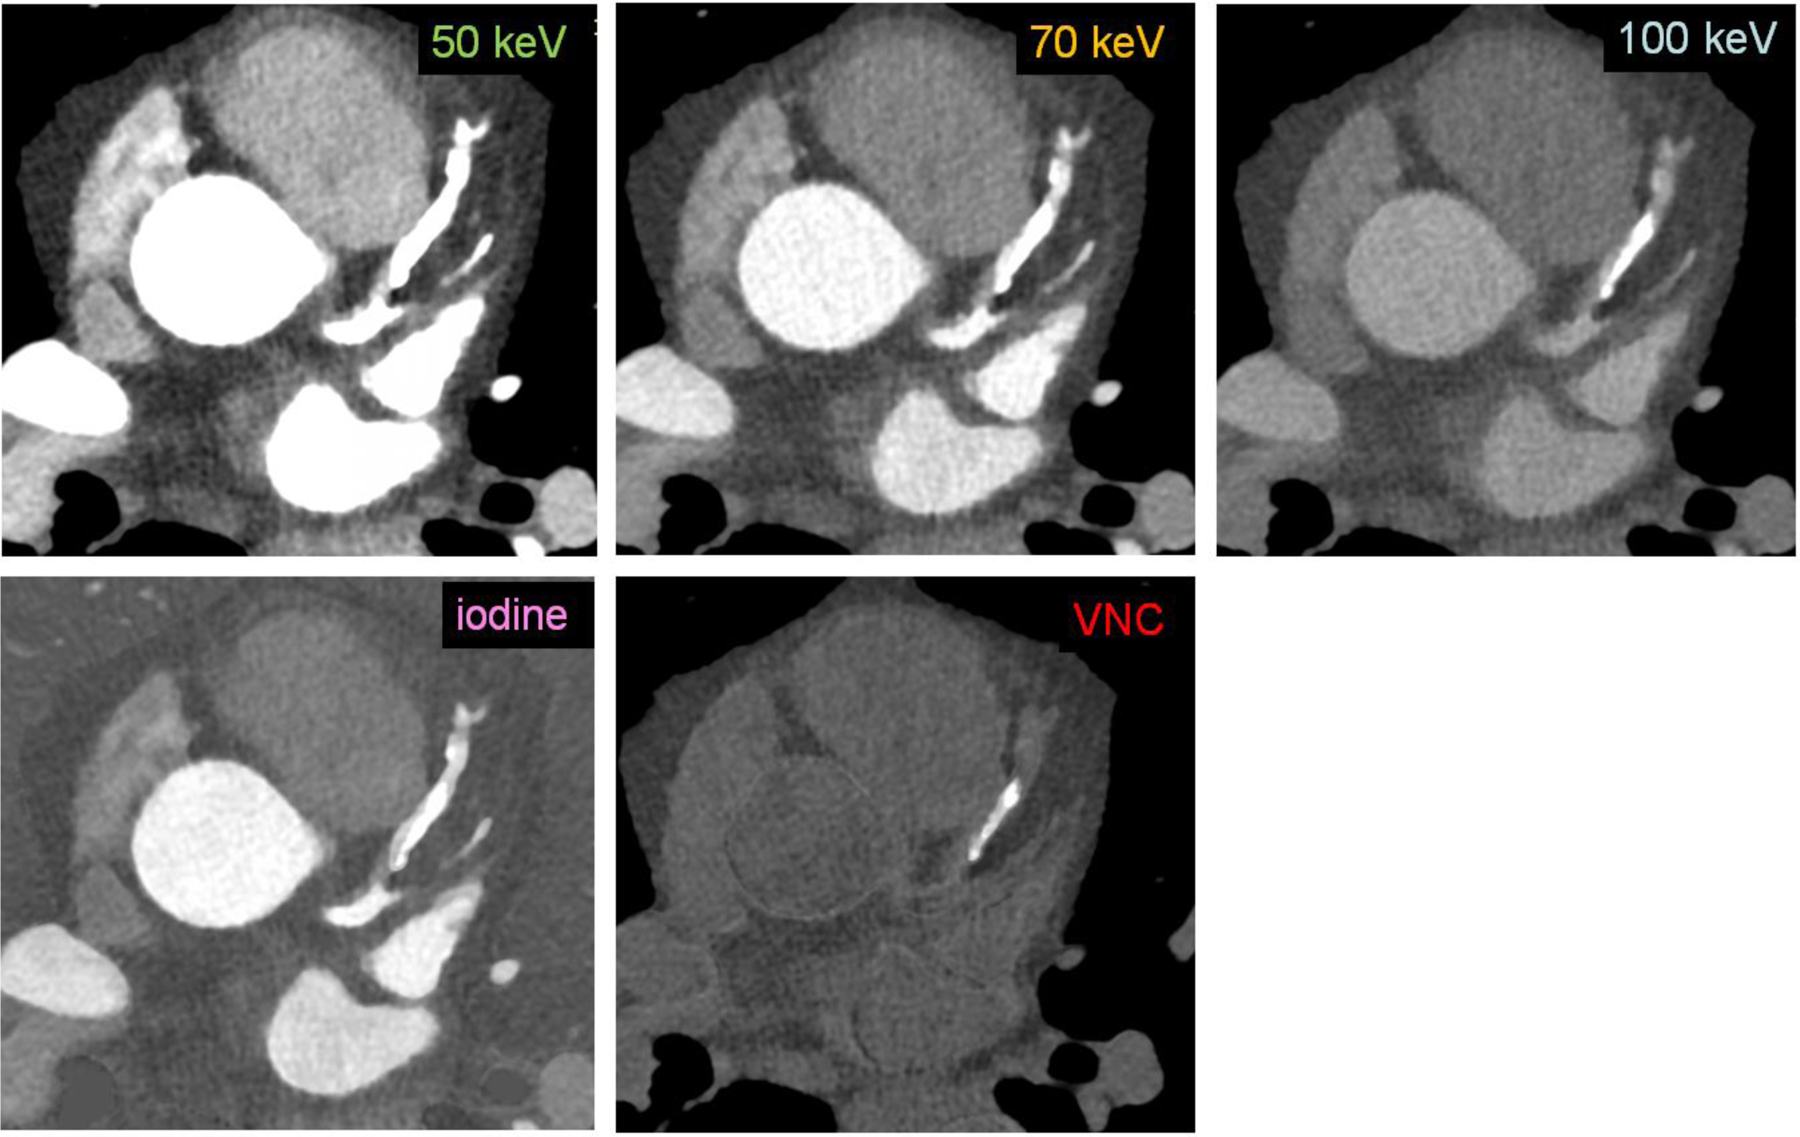
Sample patient coronary CTA images from a PCD-CT (window width/window level: 900/150 HU) demonstrate the difference in appearance of calcium and iodine among the five image types (50, 70 and 100 keV VMIs, iodine, and VNC images).
Official websites use .gov
A
.gov website belongs to an official
government organization in the United States.
Secure .gov websites use HTTPS
A lock (
) or https:// means you've safely
connected to the .gov website. Share sensitive
information only on official, secure websites.
Sample patient coronary CTA images from a PCD-CT (window width/window level: 900/150 HU) demonstrate the difference in appearance of calcium and iodine among the five image types (50, 70 and 100 keV VMIs, iodine, and VNC images).