
Figure 3.
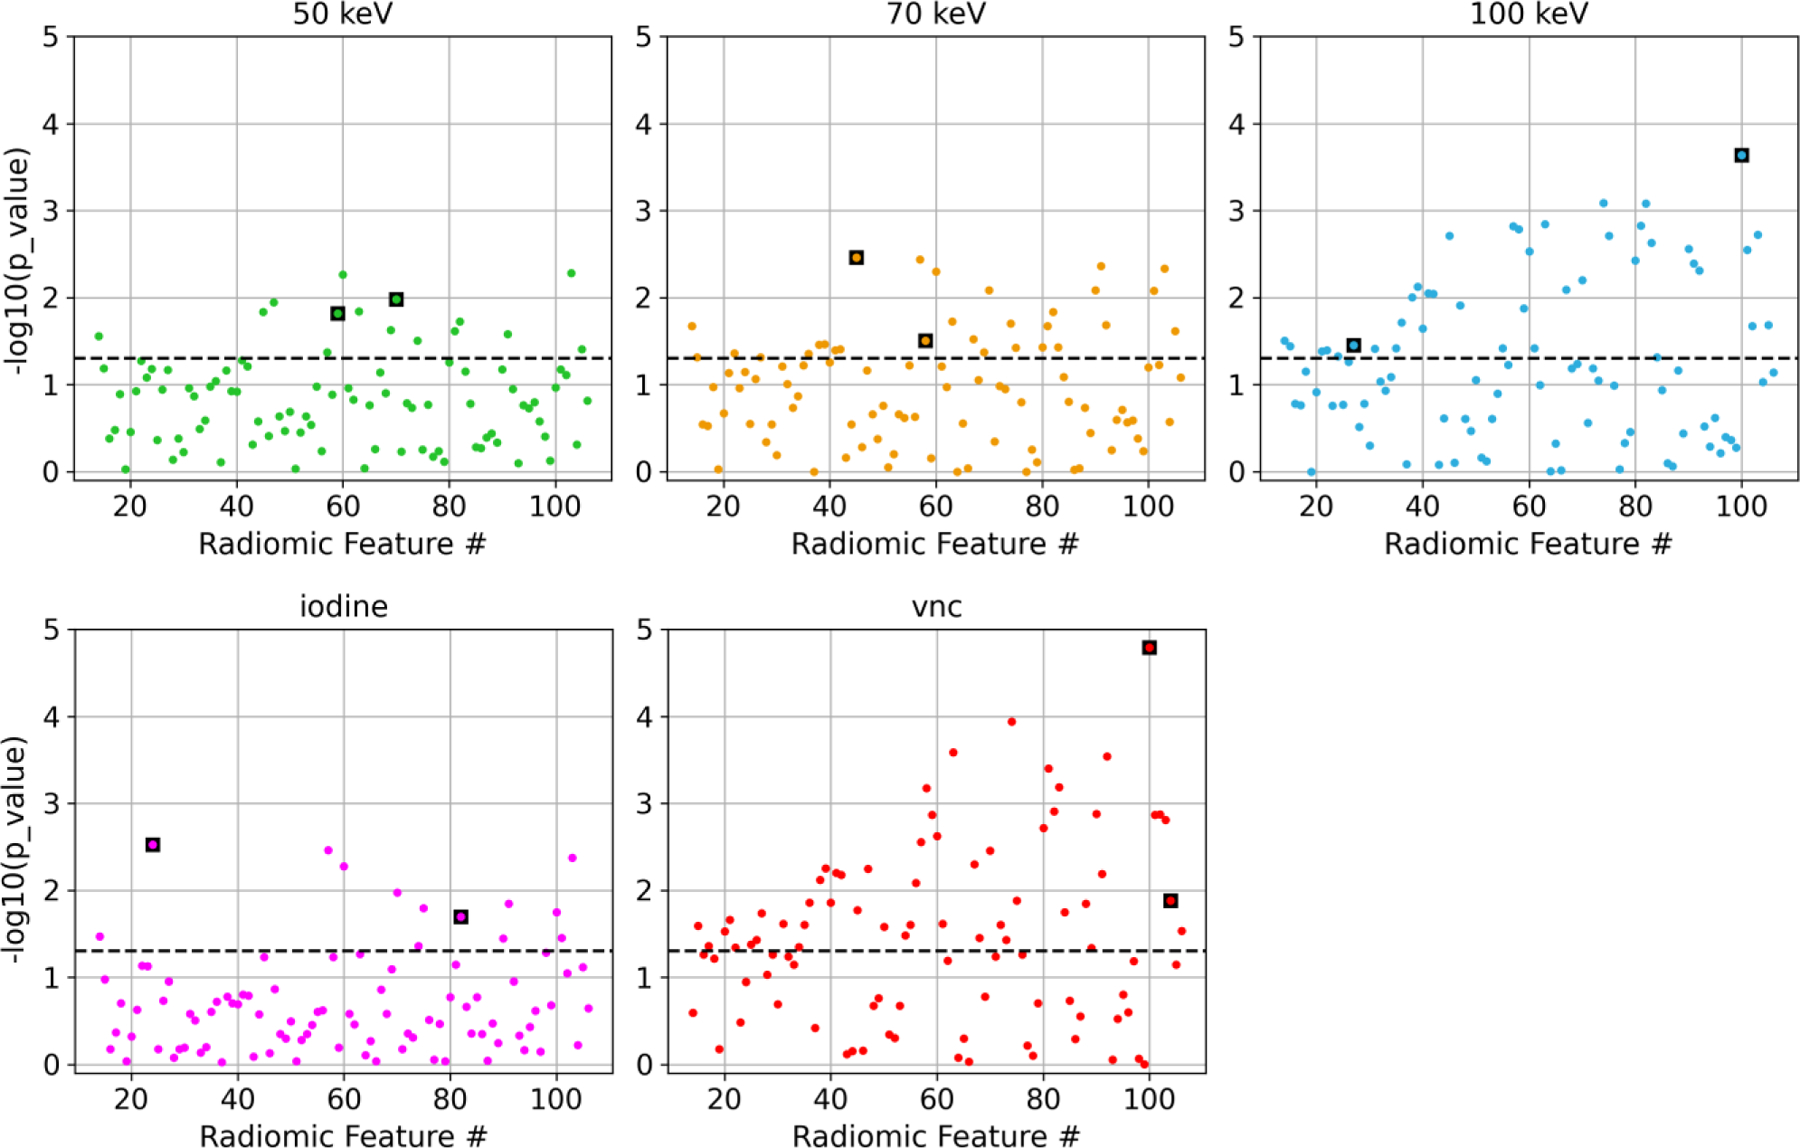
Manhattan plots showing the t-test results between low- and high-risk plaques for each radiomic feature. The black dashed line represents 5% significance level. The data points outlined in a black square were chosen as input into the ML model and are listed in Table 1. The first fourteen shape-based features were not included in the analysis.