
Figure 4.
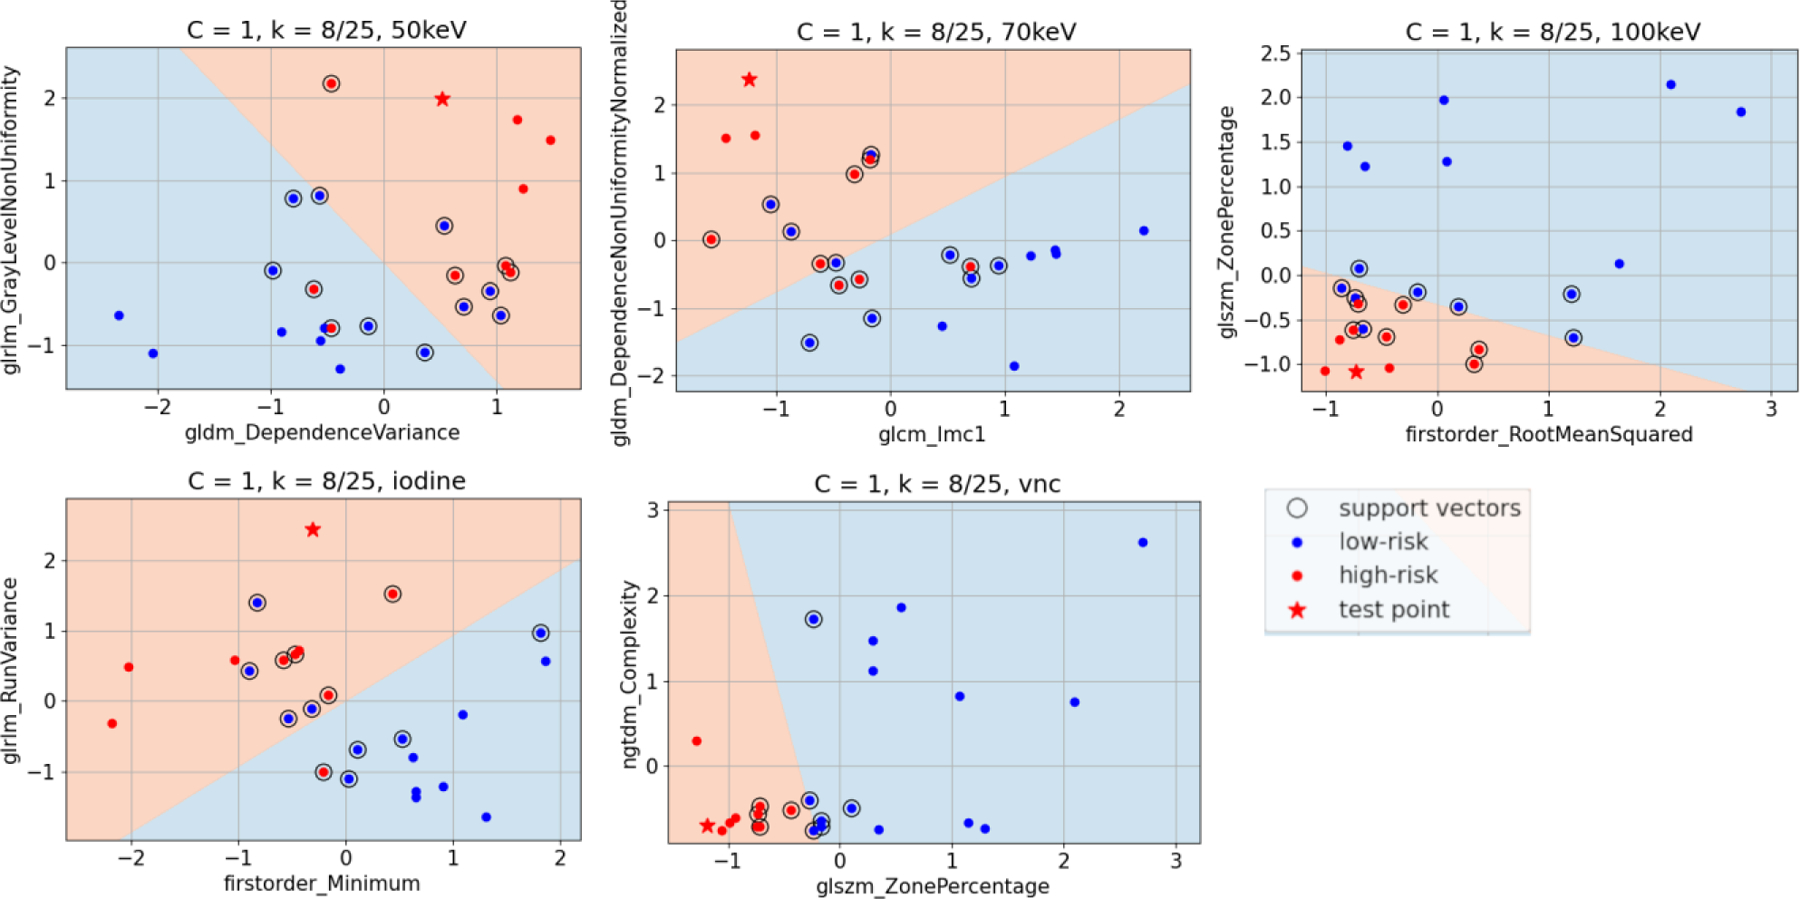
Example classification of a test point (Plaque #8 out of 25, a high-risk plaque) during LOOCV for each of the five image types using the two input radiomic features into the SVM. The linear decision boundary denotes the two classification zones, high-risk (red) and low-risk (blue) of MACE.