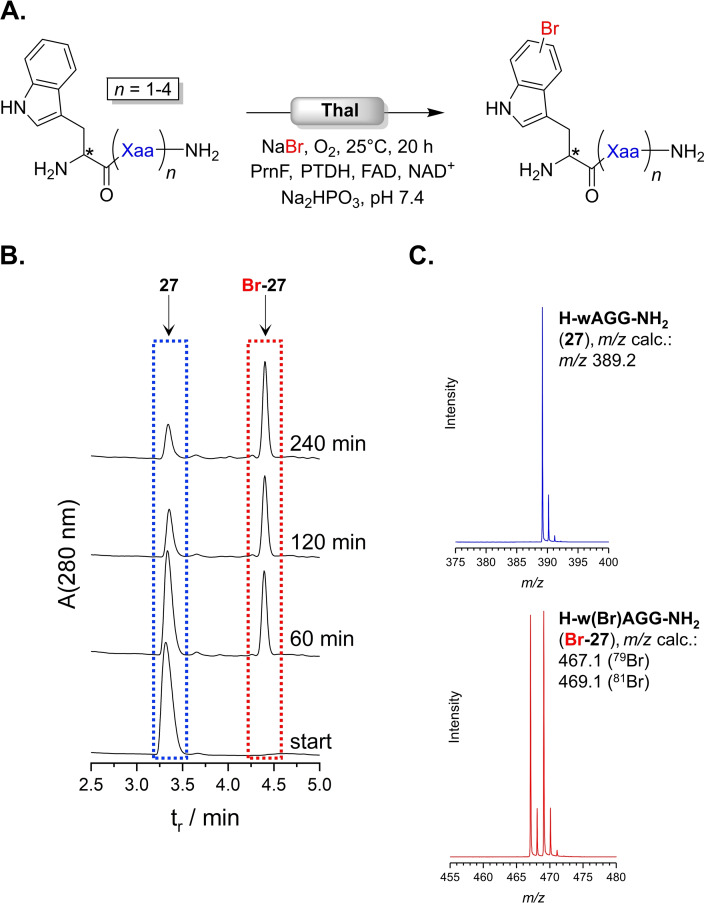
Figure 1.
(A) General scheme of Thal‐catalysed peptide halogenation. Results are shown in Table 2. (B) RP‐HPLC diagram monitoring the reaction progress of bromination of 27 (3.3 min, blue) into Br‐27 (4.4 min, red). (C) MS spectra (ESI+) corresponding to signals highlighted in HPLC trace in (B) identify substrate (3.3 min, blue) and product (4.4 min, red). The isotope pattern indicates bromination.

