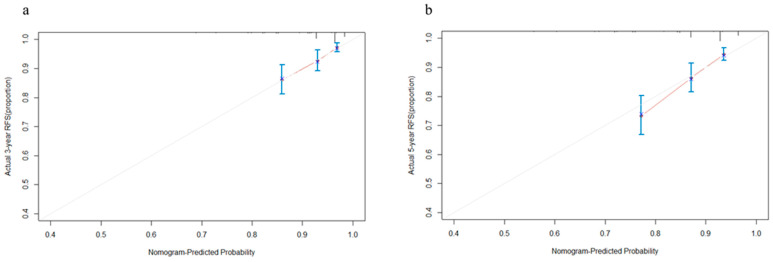
Figure 3.
Calibration curves of the nomogram for the 3- (a) and 5-year (b) recurrence-free survival prediction of patients with stage I lung adenocarcinoma. The abscissa is the predicted probability, and the ordinate is the actual observed rate. The dashed diagonal line is the reference line, which is the case when the predicted value is equal to the actual value. The line between the blue dots is the 95% confidence interval, and the red line is the curve of the actual probability of occurrence. Different colors can show the results of the study more clearly.

