
FIGURE 2.
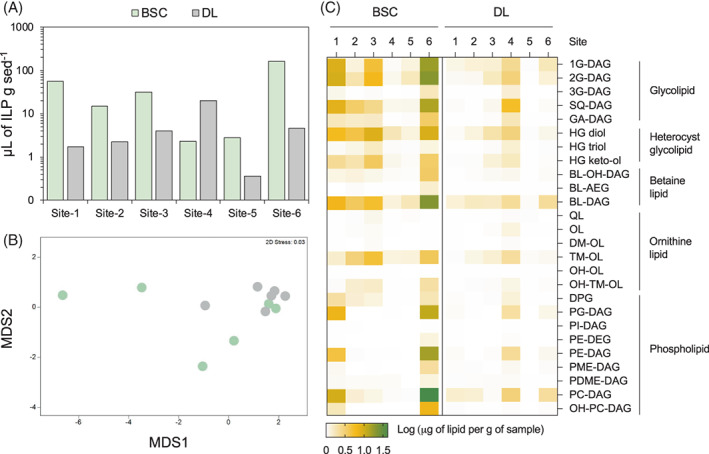
Intact polar lipid concentrations and compositions in BSCs and DLs across the six microsites. (A) Lipid concentration across the six sites in BSCs and DLs. Values are expressed as μL of IPL per gram of sediment. (B) Non‐metric multi‐dimensional scaling plot (based on Euclidean distances) of IPL composition for BSC and DL samples. (C) Relative abundance of the different IPL components across sites in BSC and DL samples; values are expressed as microlitres of IPL per gram of sediment and visualized as log‐transformed.