FIGURE 3.

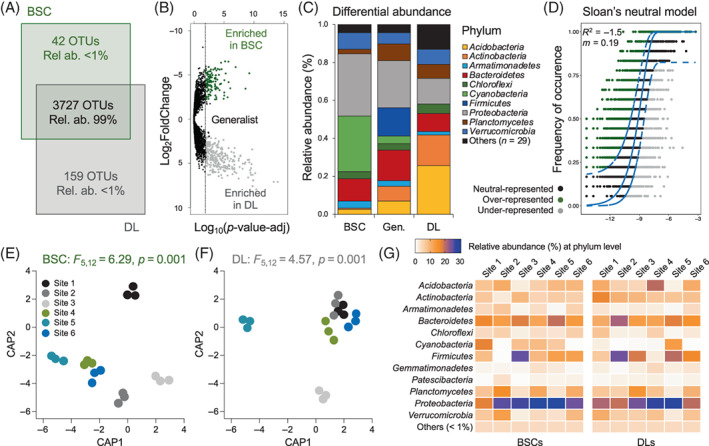
Distribution and assembly of bacterial communities associated with BSC and DL. (A) Venn diagram showing the total number of unique and shared OTUs between BSCs and DLs. (B) Volcano plot showing the OTUs that have a differential abundance (twofold changes, p < 0.05) between BSCs and DLs: OTUs enriched in BSCs are indicated by green dots and those enriched in DLs in green; generalist OTUs that do not show significantly different distribution between BSc and DL are indicated with black dots. (C) Taxonomy of BSC‐ and DL‐enriched OTUs and of generalist OTUs. (D) Fitting Sloan neutral community model with DL as the source bacterial community and BSC as the destination bacterial community (sink). The predicted neutral model (solid blue line) is surrounded by 95% confidence intervals (dashed blue lines). The frequency of detection of bacterial OTUs in BSC (sink community, y‐axis) is plotted against the relative abundance of bacterial OTUs in DL (source community, x‐axis) to indicate that the OTU is most likely neutrally dispersed into BSC (black points), over‐represented (selected for, green points), or under‐represented (selected against, grey points). (E, F) canonical analysis of principal coordinates (CAP) ordination based on Bray–Curtis similarity distances of (E) BSC and (F) DL. Colours indicate the different microsites analysed. (G) Relative abundance of most abundant phyla (average, >1%) across sites in BSC and DL samples; values are expressed as percentages calculated on the mean of the three replicates analysed.
