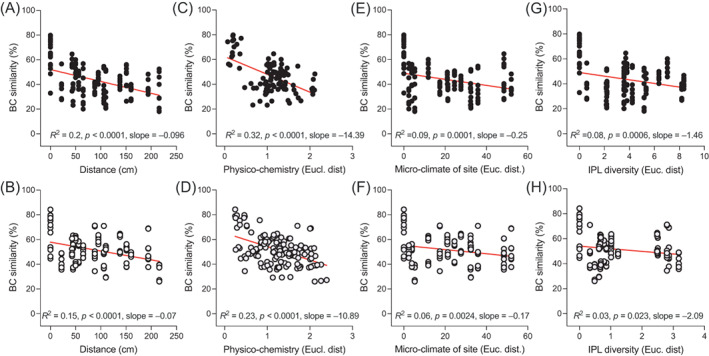
FIGURE 4.

Relationship of beta‐diversity and environmental parameters characterizing the microsites. Bray–Curtis similarity distance decay in function of (A, B) the vertical distance from the above moraine level, (C, D) the overall physico‐chemical conditions (Euclidean distance of data reported in Table 1), (E, F) the micro‐climatic conditions of each site at the day of sampling (Euclidean distance of data reported in Figure 1), and (G, H) the intact lipid composition (Euclidean distance of data reported in Figure 2) in BSC and DL samples, respectively. Red lines indicate significant linear regressions; p‐values, R 2 and slopes are reported in the graphs.
