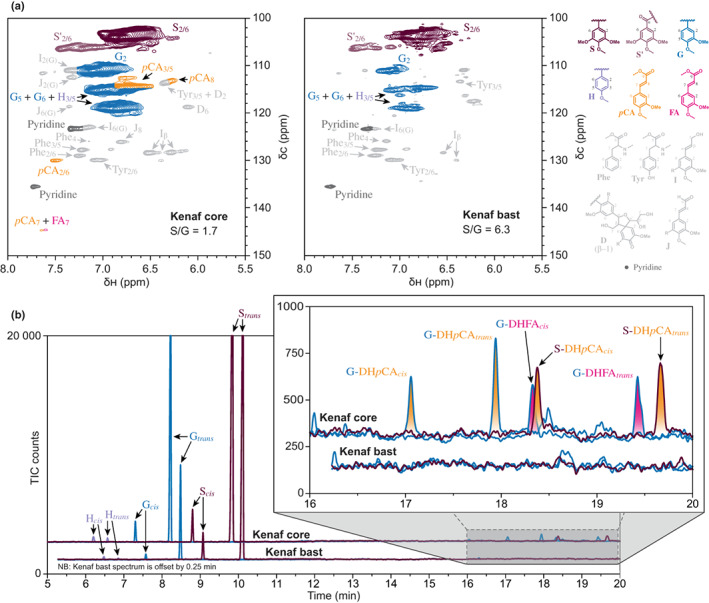
Fig. 1.

Evidence that kenaf core lignin naturally contains pCA groups. (a) 2D‐NMR 1H–13C HSQC spectra for enzyme‐lignin preparations of kenaf core and bast tissues, as labelled, showing the aromatics region. The colour coding and peak annotations for p‐hydroxyphenyl (H, mauve), guaiacyl (G, blue) and syringyl units (S and S′, dark and light purple), as well as p‐coumarate (pCA, orange) and ferulate groups (FA, pink), are elaborated with the structures shown. Also shown, in grey, are peaks corresponding to phenylalanine (Phe), tyrosine (Tyr), cinnamyl alcohol endgroups (I), cinnamaldehyde endgroups (J) and spirodienone units (D). (b) Multiple reaction monitoring traces from GC–MS analysis of derivatisation followed by reductive cleavage reaction products corresponding to kenaf core and bast tissues, as labelled. The spectrum for kenaf bast is delayed by 15 s. Peaks corresponding to cis‐ and trans‐ isomers of monolignols (H, mauve; G, blue; S, dark purple) and monolignols conjugated with p‐coumarate (coniferyl 7,8‐dihydro‐p‐coumarate, G–DHpCA and sinapyl 7,8‐dihydro‐p‐coumarate, S–DHpCA, yellow) and ferulate (coniferyl 7,8‐dihydro‐ferulate, G–DHFA, pink) are labelled and colour‐coded with reference to the structures shown.
