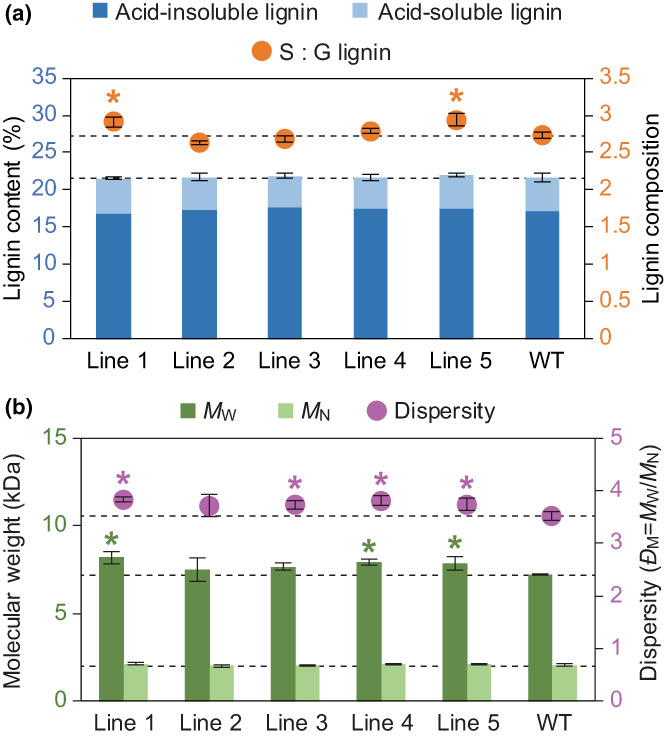
Fig. 4.

Lignin analysis of transgenic poplar expressing HcPMT. (a) The Klason lignin content is plotted on the left axis with the acid‐insoluble and acid‐soluble fractions shown in dark and light blue, respectively. The ratio of syringyl (S) : guaiacyl (G) lignin monomers is plotted on the right axis in orange. (b) The molecular weight of enzyme‐lignin samples is plotted on the left axis on a weight basis (M W) in dark green and on a number basis (M N) in light green. The dispersity (Đ M = M W/M N) is plotted on the right axis in magenta. Values marked with an asterisk are significantly different from the wild‐type (WT) control (one‐way ANOVA with Dunnett's test, n = 5 for each line using triplicates with P‐value < 0.05 in a and n = 3 for each line with P‐value < 0.1 in b). Error bars correspond to SD.
