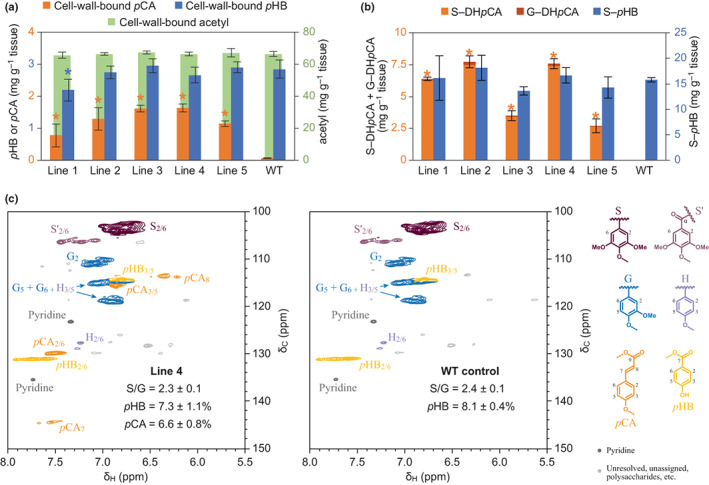
Fig. 5.

Analysis of lignin acylations in transgenic poplar expressing HcPMT. (a) The amounts of ester‐linked p‐coumarate (pCA) and p‐hydroxybenzoate (pHB) released by alkaline hydrolysis are plotted on the left axis in orange and blue, respectively. Cell‐wall‐bound acetyl is plotted on the right axis in green. (b) The amounts of the peracetates of sinapyl dihydro‐p‐coumarate (S–DHpCA) and coniferyl dihydro‐p‐coumarate (G–DHpCA) released by DFRC are plotted on the left axis in light orange and dark orange, respectively. Sinapyl p‐hydroxybenzoate (S–pHB) is plotted on the right axis in blue. Values marked with an asterisk are significantly different from the wild‐type (WT) control (one‐way ANOVA with Dunnett's test, n = 5 in (a) and n = 3 in (b) for each line using technical triplicates, P‐value < 0.05). Error bars correspond to SD. (c) Partial 2D‐NMR 1H–13C HSQC spectra for enzyme‐lignin samples of line 4 and the WT control, as labelled, showing the aromatic region. The peak annotations for p‐hydroxyphenyl (H, light purple), guaiacyl (G, blue) and syringyl units (S and S′, dark and light purple), as well as p‐coumarate (orange) and p‐hydroxybenzoate pendent groups (yellow) are elaborated with the structures shown at the side. Proportions for integrated peak volumes are provided as the mean ± SE for three biological replicates.
