FIGURE 4.

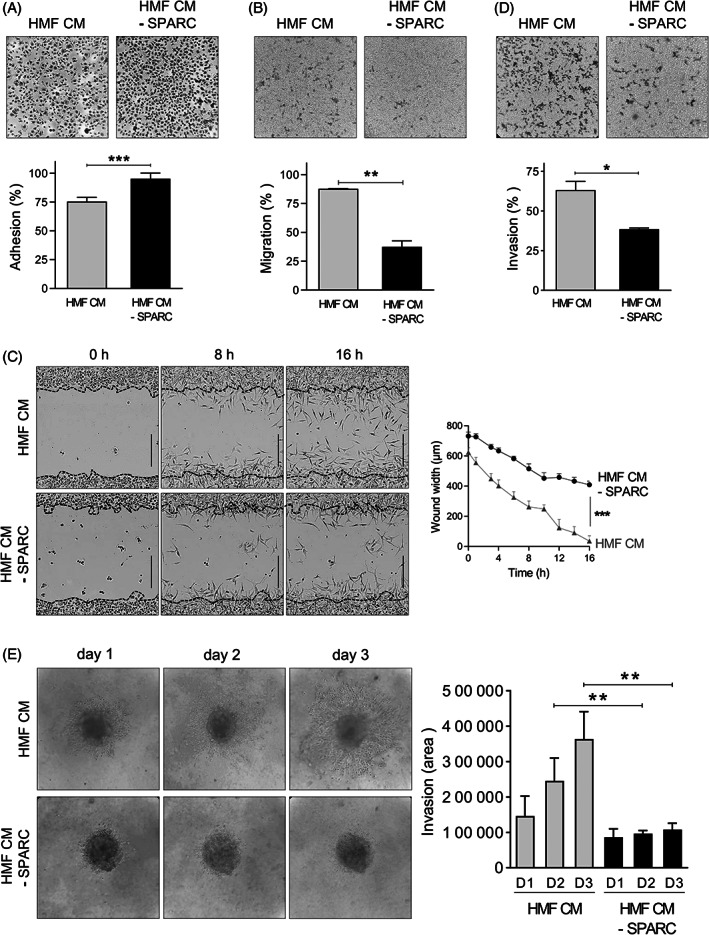
Effects of fibroblast‐secreted SPARC on TNBC cell adhesion, migration and invasion. (A) Cell adhesion. MDA‐MB‐231 cells were let to adhere on a fibronectin matrix in the presence of HMF conditioned medium (HMF CM) or SPARC‐immunodepleted HMF CM (HMF CM—SPARC) for 30 min. Upper panels, representative images of adherent cells stained with crystal violet. Lower panel, adhesion was quantified at 570 nm. Data are the mean (% of seeded cells) ± SD (n = 5); ***P < .001 (Student's t test). Similar results were obtained in three independent experiments. (B) Cell migration. MDA‐MB‐231 cells were let to migrate for 16 h on a fibronectin matrix in the presence of HMF CM or SPARC‐immunodepleted HMF CM (HMF CM ‐ SPARC). Upper panels, representative images of migrating cells stained with crystal violet. Lower panels, quantification of migrating MTT‐stained cells (absorbance was read at 570 nm). Data are the mean (% of seeded cells) ± SD (n = 3); **P < .01 (Student's t test). Similar results were obtained in three independent experiments. (C) Cell migration induced by wound healing. MDA‐MB‐231 sub‐confluent cell layers were wounded using the 96‐well IncuCyte scratch wound assay. Left panels, representative images of MDA‐MB‐231 wound healing over time (t = 0 h, t = 6 h, t = 16 h) in the presence of HMF CM or SPARC‐immunodepleted HMF CM (HMF CM ‐ SPARC). In the left panels, the initial scratch wound is delimited by the dashed lines. Bars, 400 μm. Right panel, wound healing (wound width, in μm) in the presence of HMF CM or SPARC‐immunodepleted HMF CM (HMF CM ‐ SPARC) was quantified over time. The data are the mean ± SD (n = 3); ***P < .001 (Student's t test). Similar results were obtained in another independent experiment. (D) Cell invasion. MDA‐MB‐231 cells were let to invade on a Matrigel matrix in the presence of HMF CM or SPARC‐immunodepleted HMF CM (HMF CM ‐ SPARC) for 16 h. Upper panels, representative images of invading cells stained with crystal violet. Lower panels, invading cells were stained with MTT and quantified at 570 nm. Data are the mean (% of seeded cells) ± SD (n = 3); ***P < .001 (Student's t test). Similar results were obtained in three independent experiments. (E) Cell invasion in tumor spheroid assay. MDA‐MB‐231 tumor spheroids embedded in collagen I gel were let to invade in the presence of HMF CM or SPARC‐immunodepleted HMF CM (HMF CM ‐ SPARC) for 3 days. Left panels, representative images of invading MDA‐MB‐231 cells. Right panel, the invading MDA‐MB‐231 cell area was quantified using Image J. Data are the mean ± SD (n = 5); **P < .01 (Student's t test).
