FIGURE 4.

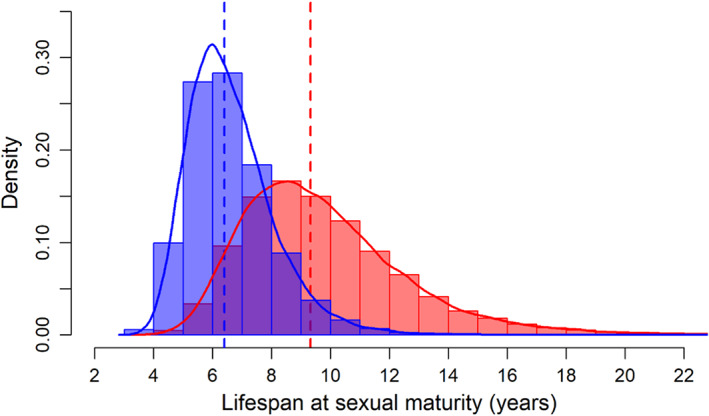
Histogram of posterior distribution of mean life expectancy in males (blue) and females (red) after reaching sexual maturity (~2 years). Dashed lines indicate the median values of each sex.

Histogram of posterior distribution of mean life expectancy in males (blue) and females (red) after reaching sexual maturity (~2 years). Dashed lines indicate the median values of each sex.