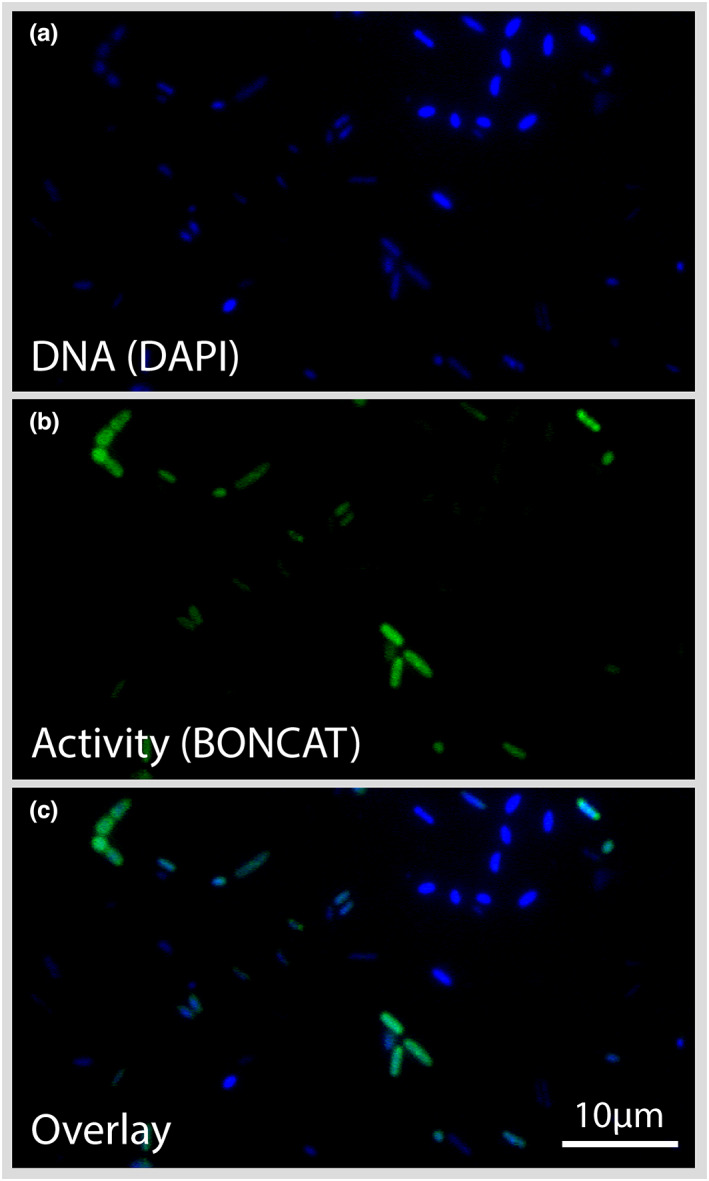
FIGURE 3.

Epifluorescence microscopy. Single‐cell visualization of translational activity observed for bacteria from the ice sample MIT5 from Mittivakkat glacier. Panels from top to bottom: (a) DAPI staining of DNA in blue; (b) protein synthesis‐active cells via BONCAT in green; and (c) an overlay showing active (green) and inactive (blue) cells.
