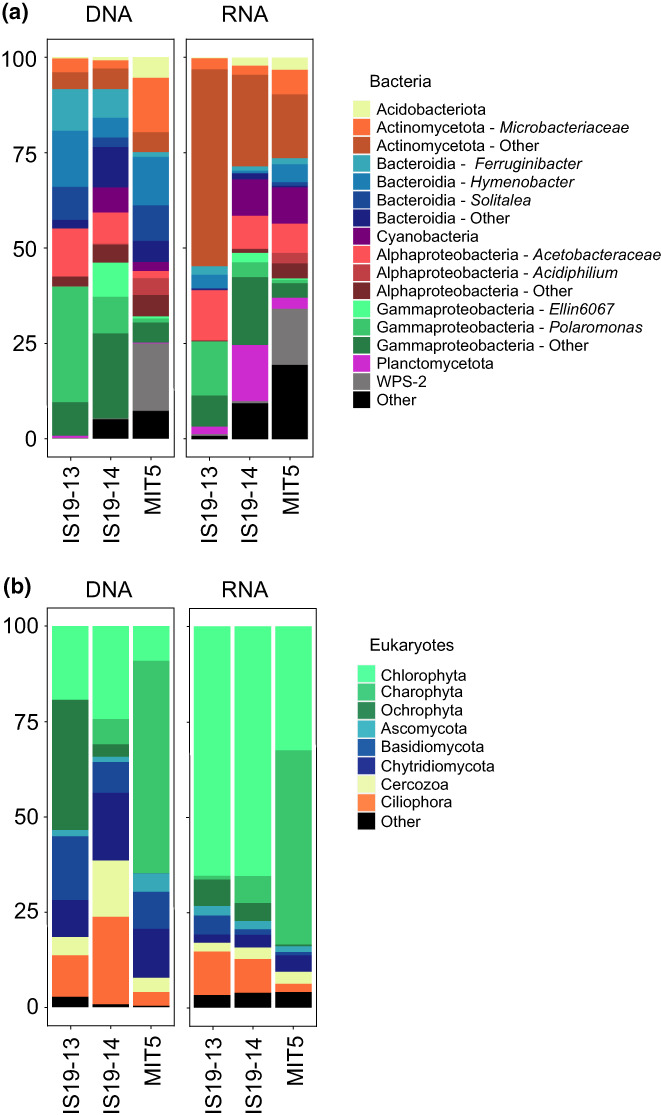
FIGURE 5.

Microbial community composition and activity. Stacked bar‐plots showing (a) bacterial community composition (DNA, based on 16S rRNA gene relative abundance, %) and the active community (RNA, based on 16S rRNA gene expression from total RNA, %). The most abundant ASVs are shown. The remaining ASVs within one class are combined into phylum/class. ASVs within one class share broadly the same hue. (b) Eukaryotic community composition (DNA, based on 18S rRNA gene relative abundance) and the active community (RNA, based on 18S rRNA gene expression from total RNA, %).
