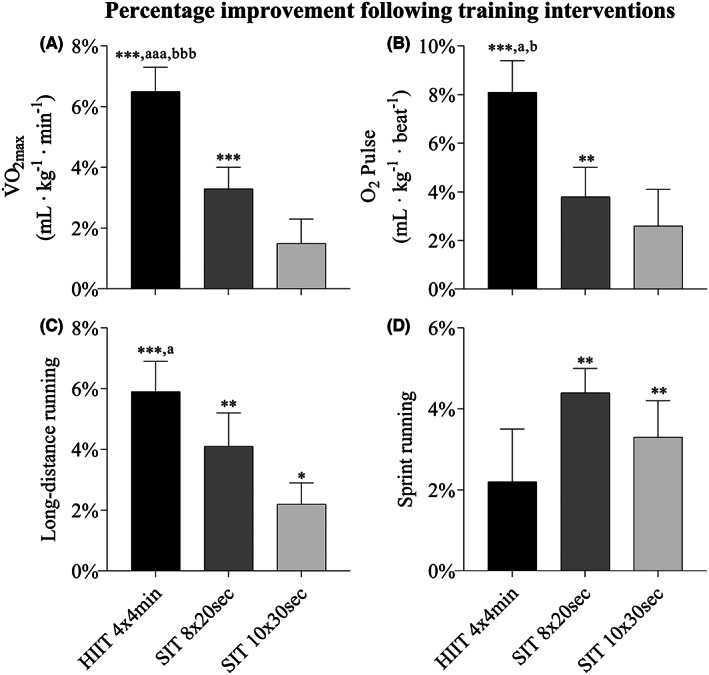
FIGURE 3.

Percentage change in V̇O2max (A), O2 pulse (B), 3000‐meter running performance, (C) and 300‐m running performance (D) from pre‐ to posttest. 4 × 4 min, 4 × 4 min running at ~95% of maximal aerobic speed (MAS) interspersed by 3 min active recovery; 8 × 20 s, 8 × 20 s exhaustive running at ~150% of MAS interspersed by 10 s passive recovery; 10 × 30 s, 10 × 30 s maximal running (average of ~175% MAS) interspersed by 3.5 min active recovery. Data presented as mean and standard error of the mean. Significant different change from pre‐ to posttest within group (*p ≤ 0.05, **p ≤ 0.01, ***p ≤ 0.001), compared to 10 × 30 s (a p ≤ 0.05, aaa p ≤ 0.001), compared to 8 × 20 s (b p ≤ 0.05, bbb p ≤ 0.001).
