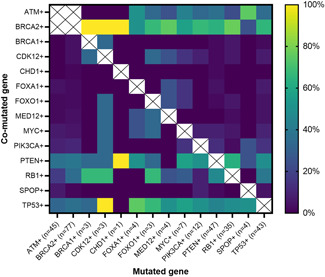
Figure 2.

Heatmap of cooccurring alterations. The X‐axis indicates the primary mutated gene (n indicates the number of patients), and the Y‐axis indicates the second comutated gene. The colored squares demonstrate the percentage of patients with a genetic mutation shown in the X‐axis, who also have a concurrent mutation denoted by the Y‐axis. Patients with both BRCA2 and ATM mutations were specifically excluded. [Color figure can be viewed at wileyonlinelibrary.com]
