Figure 1.
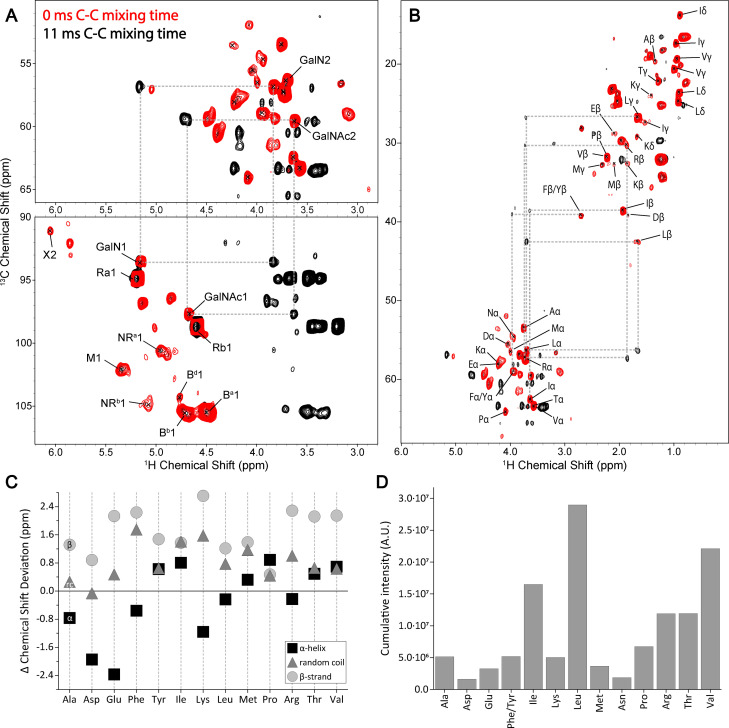
Scalar‐based hCcH ssNMR spectroscopy experiments of the S. commune cell wall. Cut‐outs from scalar 2D 1H‐detected CH correlation spectra displaying the amino‐acid Cα and polysaccharide C1 regions (A) and the amino acid backbone and sidechain regions (B) with 0 ms (red) and (black) 11 ms of C−C mixing. Dashed lines (grey) highlight the appearance of cross‐peaks. (C) Δ Chemical Shift deviation of the cell wall amino acid chemical shifts from isotropic random coil, α‐helix and β‐strand secondary structure chemical shift. (D) Cumulative intensity of cell wall amino acids. Note that Cys was not analyzed in our data. See Supporting Information for further information.

