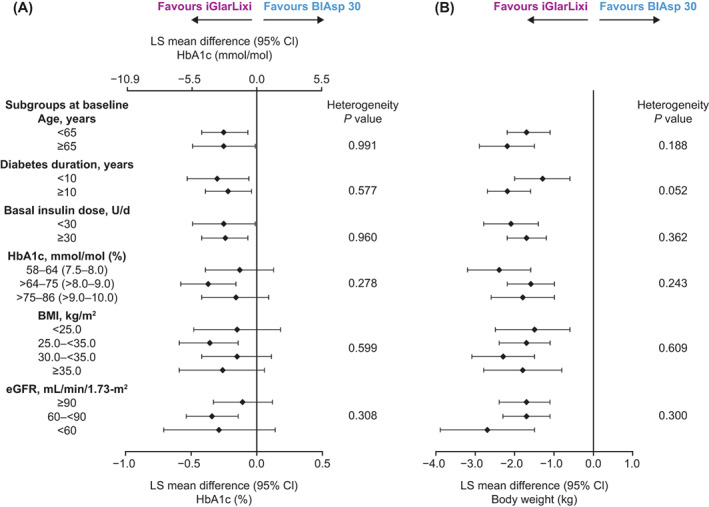
FIGURE 1.

Difference in change in primary endpoints from baseline to Week 26 by baseline characteristics' subgroups (intention‐to‐treat population). (A) Change in glycated haemoglobin (HbA1c; mmol/mol and %). (B) Change in body weight (kg). Least squares (LS) mean difference values are for iGlarLixi versus BIAsp 30. Numerical data for the confidence intervals (CIs) are given in Tables S2 and S3. BIAsp, biphasic insulin aspart; BMI, body mass index; eGFR, estimated glomerular filtration rate; FRC, fixed‐ratio combination; iGlarLixi, FRC of insulin glargine 100 U/mL and the glucagon‐like peptide‐1 receptor agonist, lixisenatide
