
FIGURE 4.
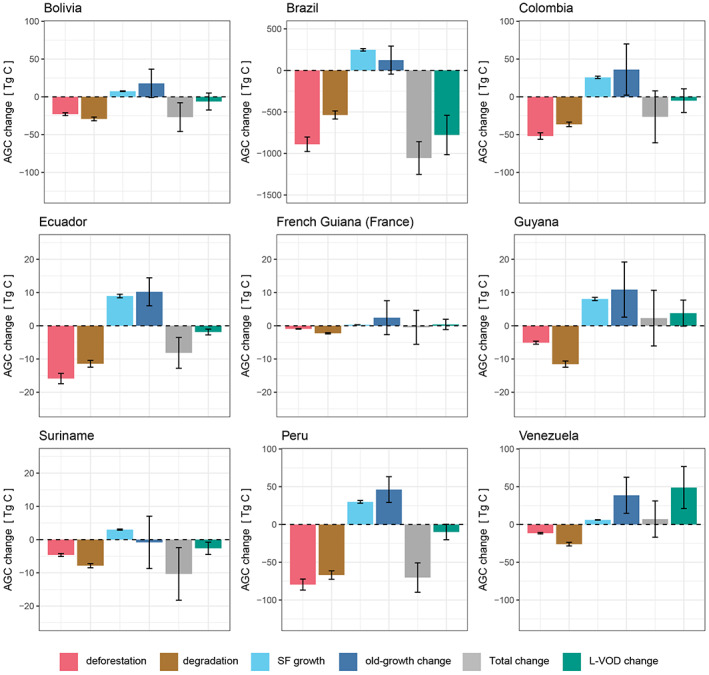
Country scale AGC changes in the Amazon forest from 2011 to 2019. AGC change associated with different processes (deforestation, degradation, secondary forest growth, old‐growth forest change), combined and L‐VOD inferred AGC change for parts of the Amazon forest divided by country, from the beginning of 2011 to the beginning of 2019. Note the different y‐axes to visualize changes for smaller countries. Whiskers represent uncertainties associated with the ESA CCI biomass map (±1 SD, for deforestation, edge and non‐edge degradation loss), from the secondary forest growth model (±1 SD of average growth rate) and uncertainties reported for old‐growth forest change and L‐VOD change inferred from ±1 SD of the ESA CCI biomass map used for calibration of L‐VOD AGC and the three L‐VOD indices (see methods). The total modelled changes include the combination of these uncertainties.