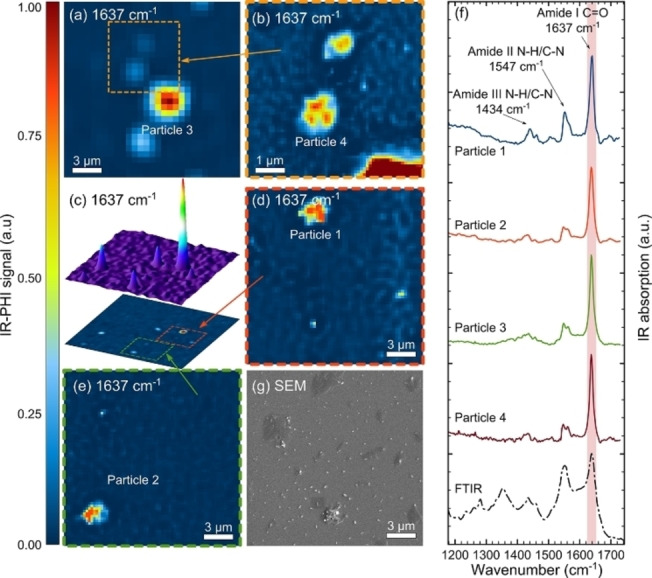
Figure 3.

a)–e) Infrared photothermal heterodyne imaging (IR‐PHI) on steeped tea bags (at 95 °C), showing the intensity maps for the 1637 cm−1 C=O vibration. Note that the orange, green, and red boxes define the magnified scan areas. f) The specific spectra recorded on the labeled particles highlight the spectral components (representing Nylon) measured at such a high spatial resolution on particles ≤3 μm. g) A correlative scanning electron microscopy (SEM) micrograph confirms the MNPs presence and morphology. Reproduced with permission from ref. [50]. Copyright 2021 American Chemical Society.
