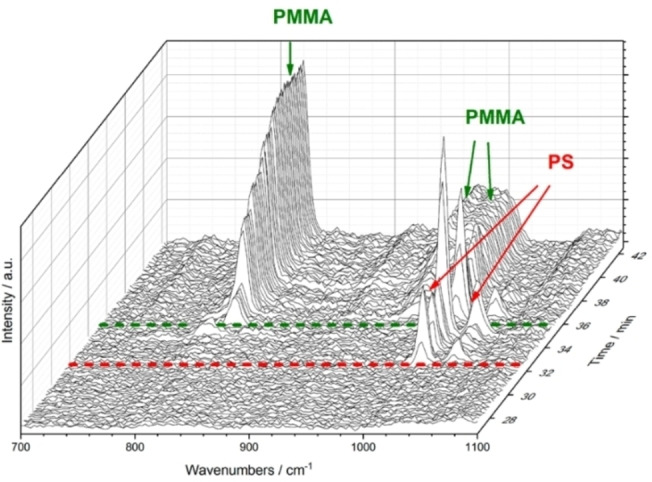
Figure 4.

3D Raman spectroscopy plot over time, demonstrating the proper asymmetric flow field flow fractionation (AF4) and subsequent chemical identification, in which the smaller (350 nm) PS particles come off first, as seen from their characteristic Raman bands, followed by the larger (500 nm) PMMA particles. Adapted with permission from ref. [64]. Copyright 2020 American Chemical Society.
