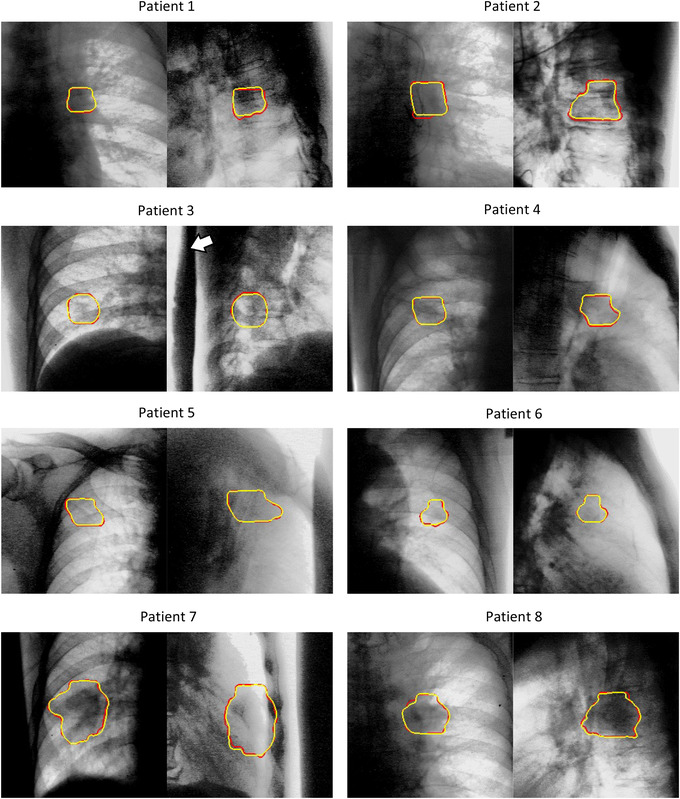
FIGURE 5.

Segmentation results in the exhalation phase T50. The pair images show frontal and lateral X‐ray fluoroscopic images (yellow contour: projected‐clinical‐target‐volume by the proposed method, red contour: ground truth). The white arrow shows a Pb shield that reduces overexposure. The image contrast was tuned to enhance the view.
