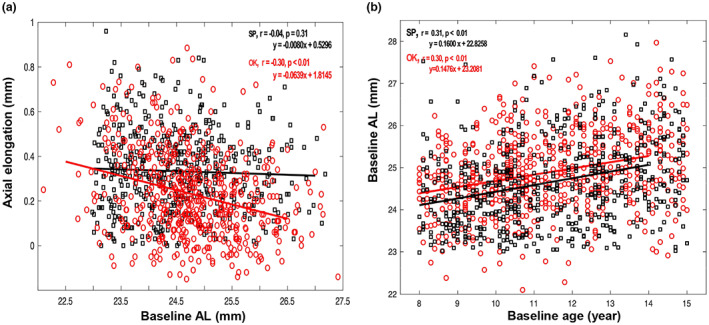
FIGURE 2.

(a) Scatterplots showing the correlation of axial elongation over 1 year with baseline axial length (AL) in the orthokeratology (OK) and spectacle (SP) groups. (b) Scatterplots demonstrating the relationship between baseline AL and baseline age in the ortho‐k (OK) and spectacle (SP) groups.
