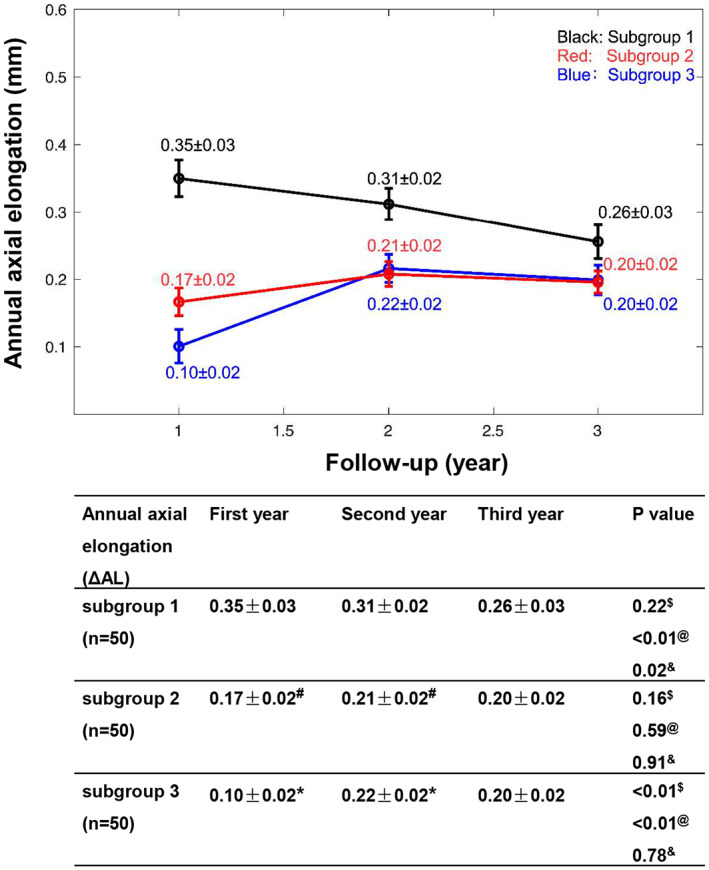
FIGURE 6.

The time course of changes in axial length (AL) over the 3‐year study period for younger children (8–11 years of age) wearing orthokeratology (ortho‐k) lenses stratified by baseline AL: Subgroup 1 (AL < 24.5 mm), subgroup 2 (24.5 ≤ AL < 26 mm) and subgroup 3 (AL ≥ 26 mm). Data are expressed as the mean ± SEM. #Subgroup 1 versus subgroup 2, p < 0.01, *subgroup 1 versus subgroup 3, p < 0.01, $first year change in axial length (ΔAL) versus second year ΔAL, @first year ΔAL versus third year ΔAL, &second year ΔAL versus third year ΔAL.
