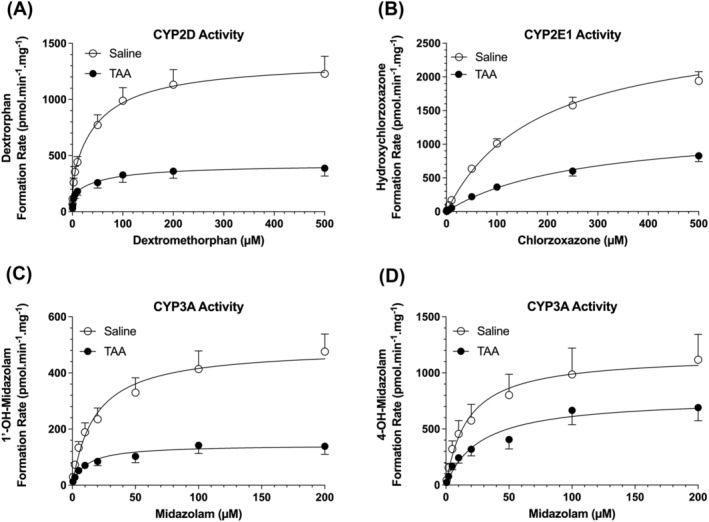
FIGURE 6.

Michaelis–Menten plots of CYP2D‐mediated dextromethorphan O‐demethylation (A), CYP2E1‐mediated chlorzoxazone hydroxylation (B) and CYP3A‐mediated midazolam 1′‐ (C) and 4‐ (D) hydroxylation in rat liver microsomes. Animals were treated with ip injections of 200‐mg/kg TAA (n = 7) or saline (n = 7) three times a week for 10 weeks, followed by a 10‐day washout period. The symbols and error bars represent the mean and SE values, respectively, and the lines represent the nonlinear regression fit of the experimental data.
