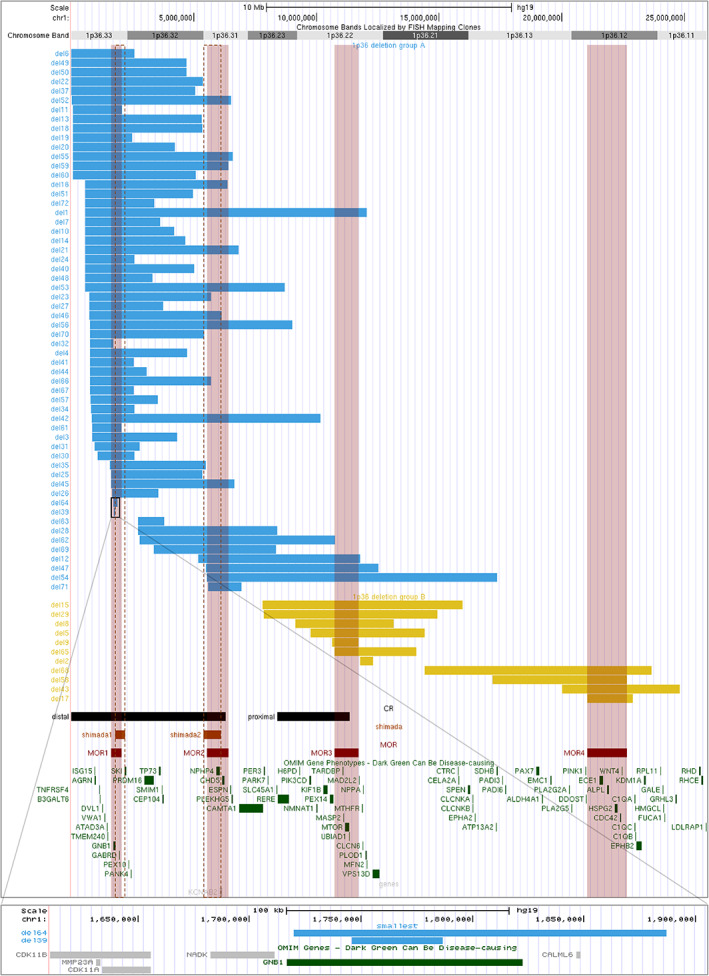
FIGURE 1.

Mapping of deletions diagnosed by CMA using UCSC genome browser (build GRCh37/hg19) and OMIM genes included in this region. Blue bars represent Group A deletions (n = 56 patients), yellow bars Group B deletions (n = 11 patients), black bars distal and proximal critical regions described in the literature, orange bars and orange vertical dotted lines critical regions described by Shimada et al., red bars and red translucent vertical lines represent the proposed four MORs: MOR1: 1,619,654‐2,057,167; MOR2: 5,528,518‐6,414,084; MOR3: 10,732,711‐11,718,611; MOR4: 21,035,150‐22,652,664. The lower box shows a zoom on the two smallest deletions excluded from the cohort and the GNB1 gene. CMA, chromosomal microarray analysis; MOR, minimal overlapping region
