Figure 1.

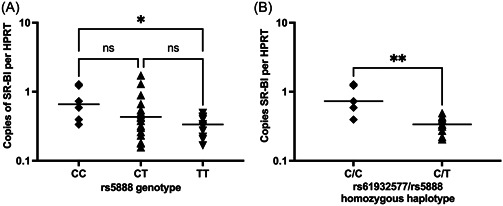
mRNA copies of SR‐BI per HPRT for SR‐BI variant rs5888 genotypes and haplotype. Log scale expression of SR‐BI per HPRT for rs5888 genotypes CC, CT and CC (A) and rs61932577/rs5888 homozygous haplotypes; C/T and C/C (B). Lines represent the median of the data set and data are representative of at least 2 repeats for each data point. *p < 0.05, **p < 0.01. Statistical comparisons performed were the Kruskal−Wallis ANOVA test with Dunn's multiple comparisons tests (A) or the Mann−Whitney test (B). ANOVA, analysis of variance.
