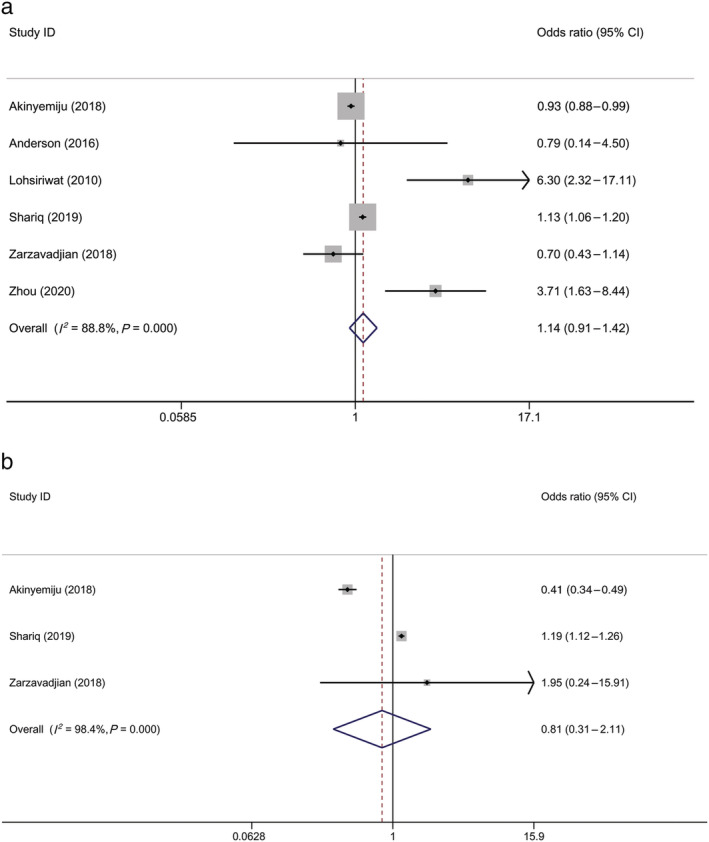
Figure 4.

Forest plot of odds ratio of (a) postoperative complications among patients with CRC, MetS versus non‐MetS, and (b) postoperative mortality among patients with CRC, MetS versus non‐MetS. Note: Weights are from random‐effects analysis. CI, confidence interval; CRC, colorectal cancer; MetS, metabolic syndrome.
