
FIGURE 4.
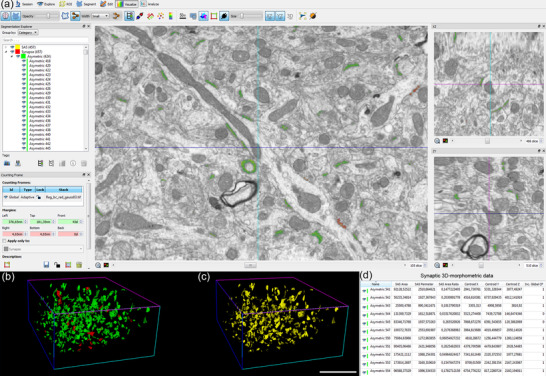
Screenshot of the EspINA software user interface. (a) In the main window, the sections are viewed through the xy plane (as obtained by FIB/SEM microscopy). The other two orthogonal planes, yz and xz, are also shown in adjacent windows (on the right). (b) 3D reconstructions of segmented AS (green) and SS (red). (c) Computed SAS for each reconstructed synapse (yellow). (d) Table of synaptic 3D morphometric data from AS automatically obtained by EspINA software. Scale bar in (c) represents 5 µm in (b) and (c).