
FIGURE 6.
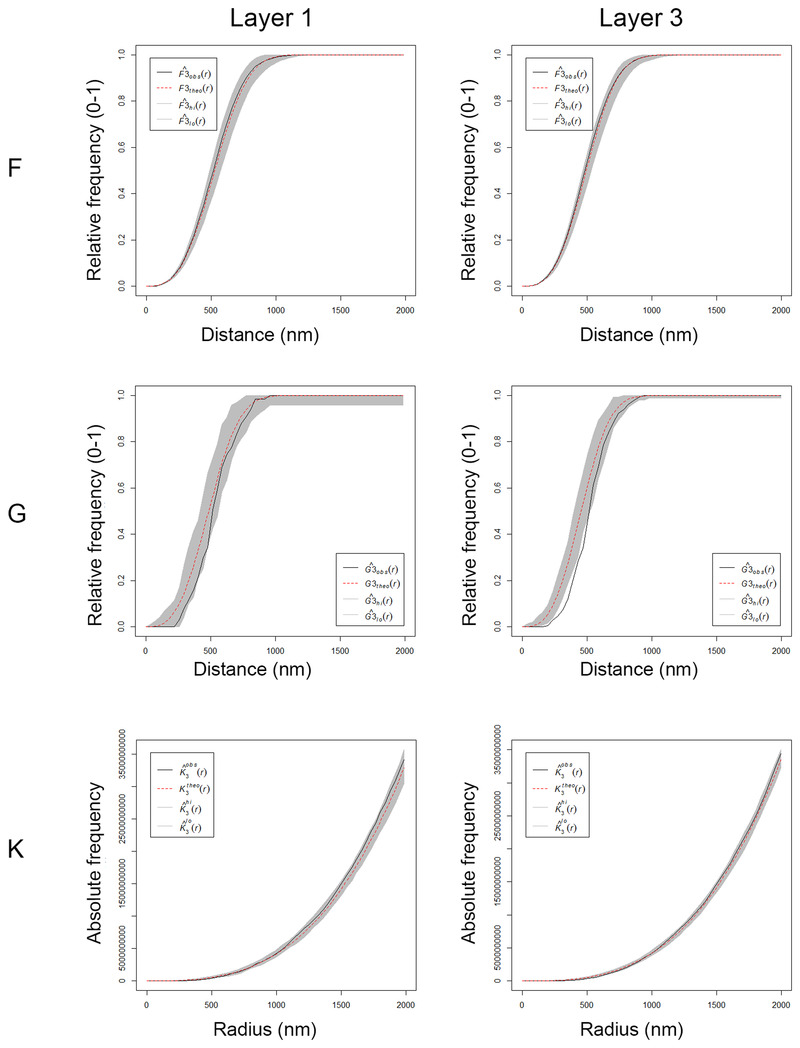
Analysis of the 3D synaptic spatial distribution in somatosensory cortex from the Etruscan shrew. Red dashed traces correspond to a theoretical homogeneous Poisson process for each function (F, G, K). The black continuous traces correspond to the experimentally observed function in the sample. The shaded areas represent the envelopes of values calculated from a set of 99 simulations. Plots show a distribution which fits into a Poisson function, but the experimental function from layer 3 for the G‐function is partially out of the envelope. Plots obtained in layer 1 and layer 3 from animal MS1.