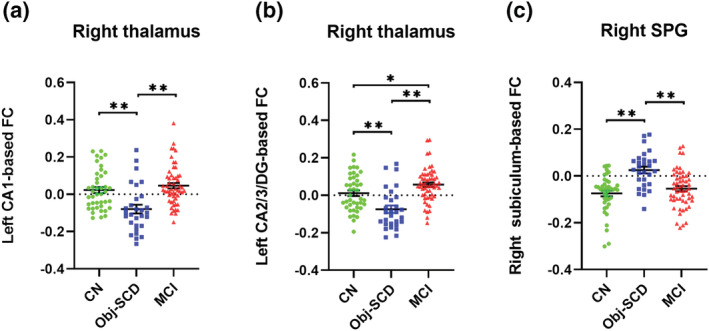
FIGURE 3.

The post hoc analysis of FC in hippocampal subfields. The Obj‐SCD group showed decreased FC between left CA1 and right thalamus (a), and between left CA2/3/DG and right thalamus (b), as well as increased FC between right subiculum and right SPG (c) compared with the CN and MCI groups. The MCI group showed increased FC between left CA2/3/DG and right thalamus compared to the CN group (b). SPG, superior parietal gyrus. *p < 0.05, ** p < 0.001
