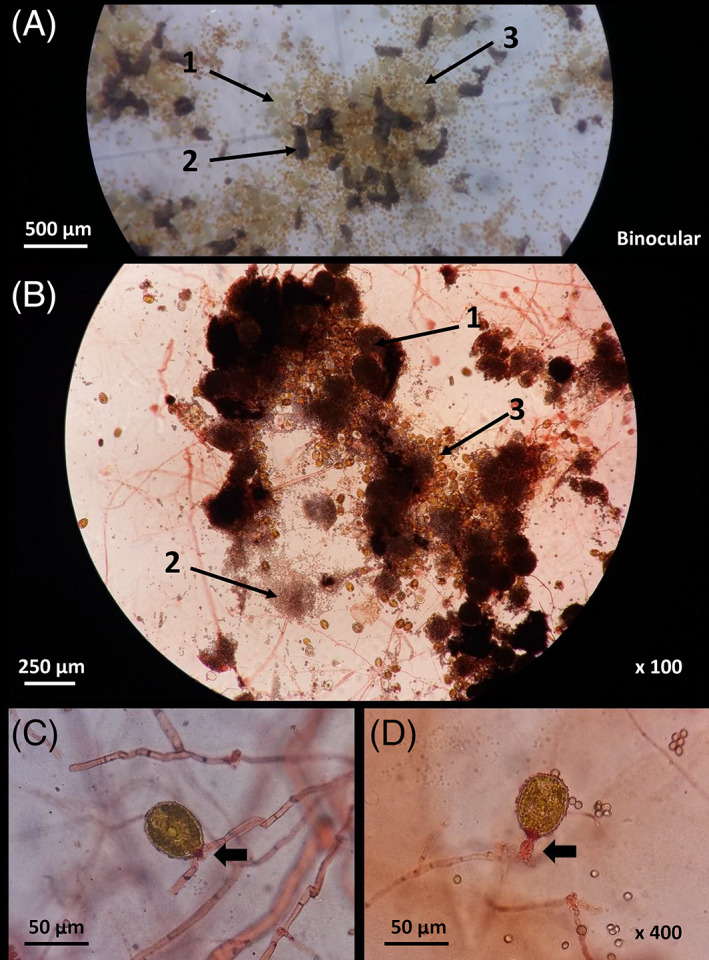
FIGURE 2.

Observation of microalgal–fungal interaction. (A) Binocular observation of co‐culture with aggregated cleistothecia (1) and conidia (2) from Aspergillus pseudoglaucus, and Prorocentrum lima cells (3). (B) Microscopic observation of co‐culture using Congo red staining (×100) highlighting cleistothecia (1) and asexual sporogenic spores (2) of A. pseudoglaucus, and P. lima cells (3). (C, D) Microscopic observation of co‐culture with Congo Red dye (1% in ethanol) (×400). The fungal mycelium is indicated (black arrows) at proximity of the apex of the microalgae where the physical interaction occurs.
