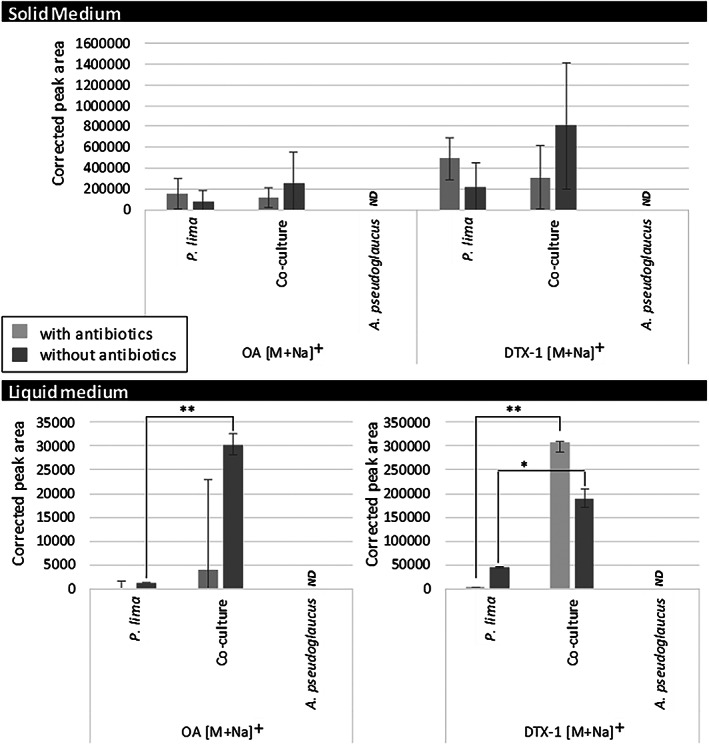
FIGURE 4.

Okadaic acid (OA) [M + Na]+ (m/z = 827.463) and dinophysistoxin 1 (DTX‐1) [M + Na]+ (m/z = 841.473) corrected peak area (peak area corrected by amount of extract) detected within LC‐HRMS data in positive ionization mode according to the type of samples where it was detected. (ND: not detected; variation significance based on student test: *p‐value ≤ 0.05, ** p‐value ≤ 0.01)
