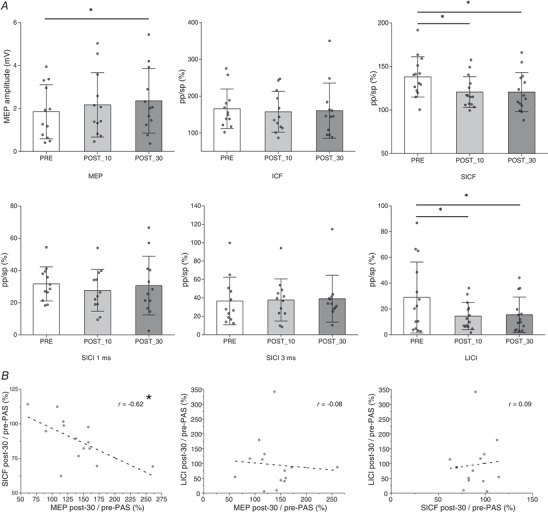
Figure 2. Results of Experiment 1 .

A, the effect of the PMv‐to‐M1 cc‐PAS protocol on the different indices. SICI, ICF and SICF are expressed as the ratio of the mean MEP amplitude (pp‐TMS/sp‐TMS). The error bars on the histograms represent the standard deviation (SD). B, correlation results between the significantly modulated indices. *P < 0.05.
