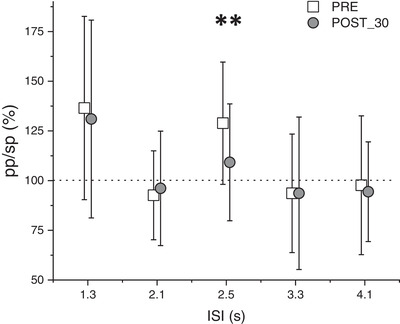
Figure 3. Results of Experiment 2; the effect of the PMv‐to‐M1 cc‐PAS on the SICF at different ISIs, each reflecting different I‐waves.

A selective modulation of the I2‐waves is observable. The error bars represent the SD. **P < 0.01, in a t test with Bonferroni correction for multiple comparison.
