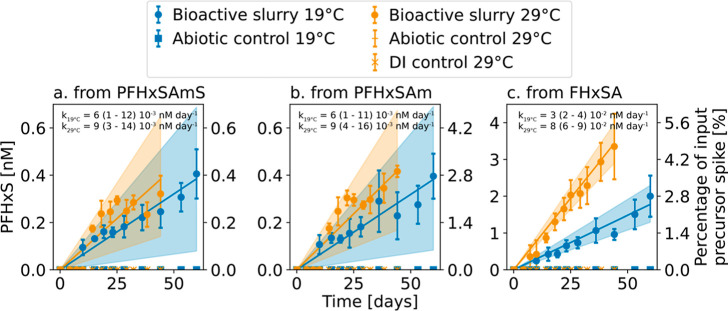
Figure 2.
Time-dependent production of PFHxS from precursor biotransformation in experiments with a water-sediment slurry. Plots show mean concentrations (circles) and standard deviations (error bars) of measurements (n = 3 per timepoint) for experiments conducted at 19 and 29 °C. The second y-axis shows the concentration normalized to the input precursor spike. Data was modeled using eq 3. Solid lines show modeled fit (expected mean) and shaded regions denote the 90th % CI. Rates (nM day–1, expected mean and 90th % CI) are shown at the top of each panel.

