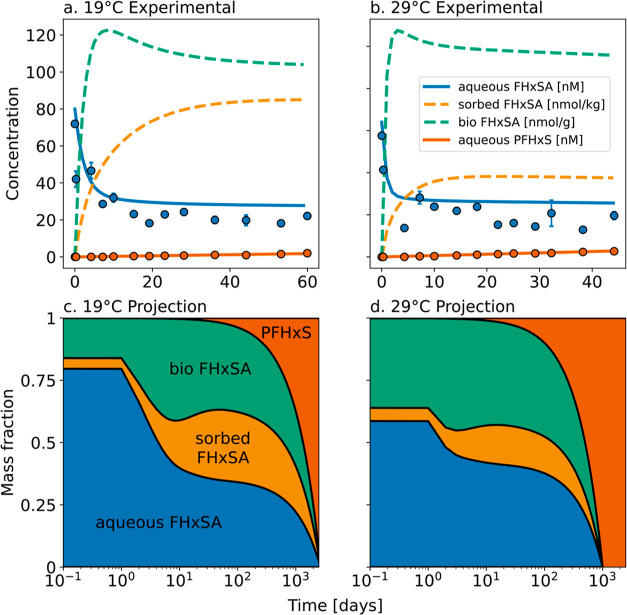
Figure 5.
Results from four-compartment box model parameterized using experimentally measured rates for timescales of FHxSA biotransformation into PFHxS. Panels (a) and (b) show the mean (circles) and standard deviation (error bars) of triplicate microcosms. Lines represent the modeled concentrations using the four-compartment model (solid lines show compartments that were directly measured, and dashed lines correspond to model results). We assume that the biological mass is 0.1% of the sediment mass to estimate the biologically associated FHxSA concentration.24 Panels (c) and (d) show the temporal evolution of FHxSA and PFHxS in the aqueous, sorbed, and biological phases.

