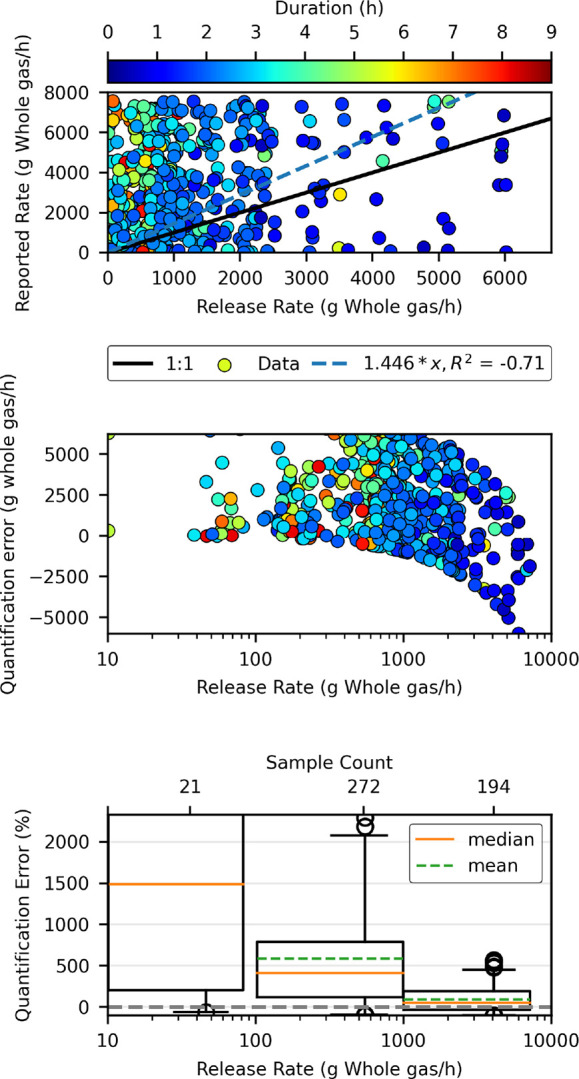
Figure 3.

Example of quantification accuracy, using TP detections for solution E as an example. Upper panel: Reported emission rate versus controlled release rate, with markers colored by controlled release duration. This panel indicates bias for a set of the release rates selected for this study but may indicate bias for a different selection of release rates. Center panel: Error in emission rate estimates, i.e. expected error for any individual result reported by the solution. Lower panel: Relative error binned by the order of magnitude of the controlled release rate. Results indicate relative quantification bias over a large number of reported estimates for each emission rate range. Note the logarithmic x-axis on the lower two panels. The y-axis was restricted to show 95% of the data on each panel; see the SI reports for full data.
